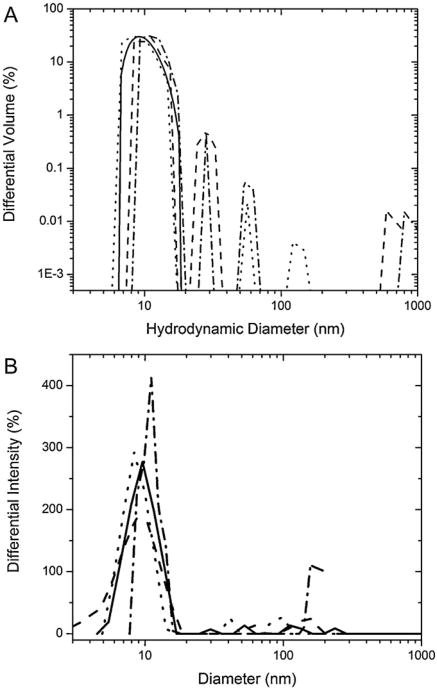
Fig. 3.
Overlay volume distribution of differential light scattering intensity found utilizing the NNLS fitting algorithm for both conditions. The hydrodynamic radii peaks show the relative size and intensity contribution to the overall scattering spectrum. The size cutoff has been selected at 1000 nm to preclude any large agglomerates, which cannot be the target protein oligomers. (A) For BSA in pH 2 solution, the size distributions have been shown in multiples of 2 day increments, starting with the initial reading day 0 (—), day 2 (– –), day 4 (⋯) and day 6 (– · –). The data has been represented in a log-log format with the lower limit set above zero to avoid discontinuities. (B) BSA pH 9 solution size distributions have been represented by 2 week increments up to the 4th week, where it was assumed small-scale oligomerization had been completed: Week 0 (—), Week 2 (– –), Week 4 (⋯) and Week 8 (– · –). The final measurement at the 8th week has been added to show the extent of these small oligomer contributions to the overall sizing. The larger aggregate contributions are not negligible in comparison to the modal peak, so a semi-log plot was chosen.

