Fig. 4.
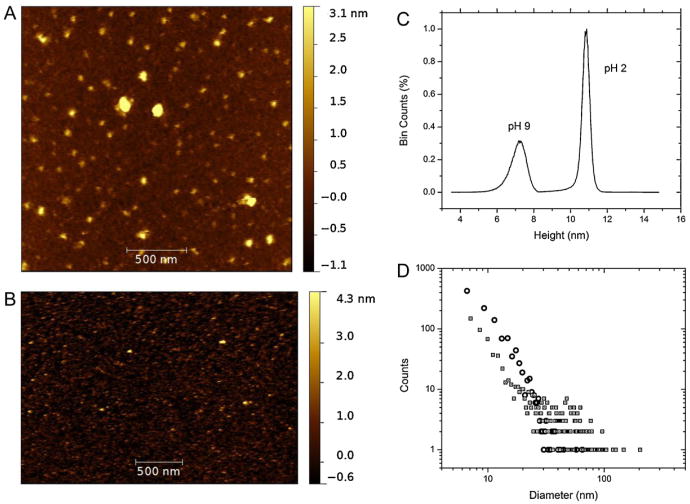
AFM imaging results for (A) pH 2 and (B) pH 9 solutions of BSA captured with FTM–AFM on cleaved mica. The scan sizes were not the same so the image resolution differs. The height distributions for both conditions are shown in (C) where the two have been combined and marked with text to distinguish between the two. The relative percentage of counts are shown in % bin counts. The equivalent disk diameters, found by threshold grain fitting of both images, representing the size of a disk large enough to cover the surface area of a particle, is shown in (D). The data has been presented in a log–log format to view the varied numbers of particles for both conditions, which were different for each image. The hollow circles represent pH 9, while the hollow squares with dots in the center represent pH 2.

