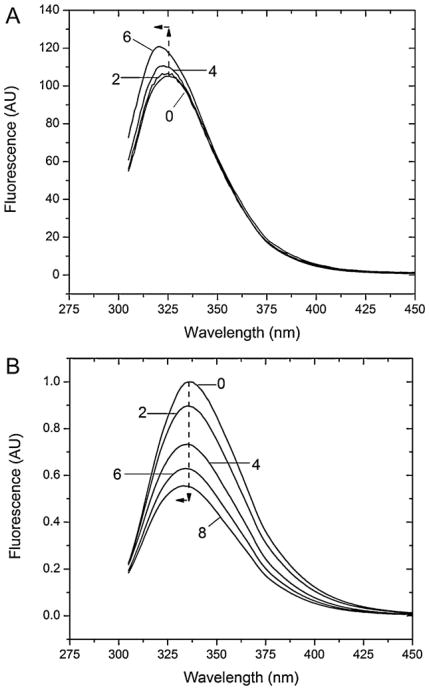
Fig. 5.
In (A) the steady state spectra of BSA at pH 2 have been presented in two days intervals, zero being the initial spectrum. The spectra show the increase of the fluorescence over the incubation time and the shift of the maximum to shorter wavelengths. In (B) the steady state spectra of BSA at pH 9 have been presented in 2 week intervals with labeling week times, zero being the initial spectra. The dotted arrows at the fluorescence peaks provide a reference to the initial week 0 peak maximum, and show the trend downward and to the left of the spectra over time. In the figure, the integrated, inner-filter effect corrected (Eq. (3)) peak intensity has been shown to preclude intensity drops as a function of peak wavelength, as such changed over the course of the experiment.

