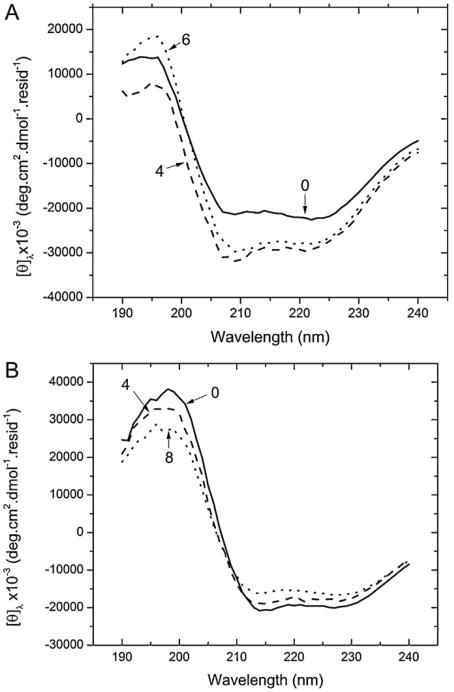
Fig. 7.
Circular dichroism spectra obtained from the solutions of BSA in (A) pH 2 solution. The spectra represent the initial (—), 4th day (– –) and 6th (⋯) day readings. The spectra has been represented in mean residue ellipticity. Labels have been placed to point out the corresponding spectra. (B) contains the spectra for pH 9 solutions of BSA. Here the data has been shown in MRE as the initial (—), 4th week (– –)and final 8th week (⋯) results to best show when the differences in aggregation time frames.

