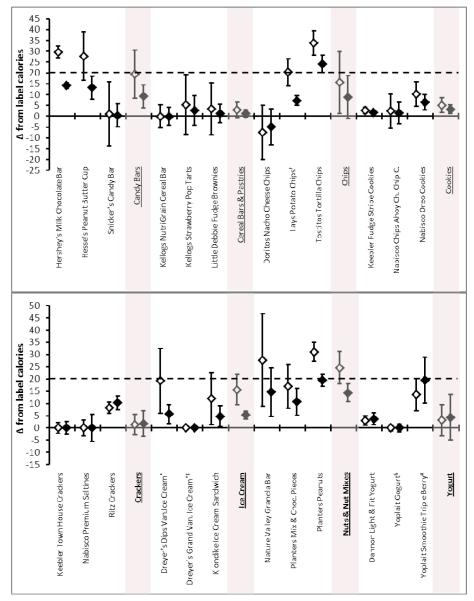
Figure 2. Deviation of metabolizable calories from label calories.
Diamonds represent mean values and error bars 95% confidence interval. The Y-axis shows the difference from label calories. Open diamonds represent mean difference in total calories and closed triangles represent mean difference in % from label calories. Group means are gray shaded. The Food and Drug Administration (FDA) allows calorie content to exceed label calories by up to 20%, shown here as dashed lines. *In other parts of the country Dreyer’s Ice Cream is sold under the name Edy’s. † During the first purchase of snack products, a large bag (containing 11 serving by label) of Lays Potato Chips was purchased. Due to the difficulty of choosing 15 equally sized chips (=serving size), we excluded the data from the first run and henceforth purchased smaller bags (1 bag = 1 serving size), thus only data from the last two runs were included in the analysis. ‡ Serving size was not determined for Dreyer’s Grand Vanilla Ice Cream due to the difficulty of ascertaining exactly how 1/2 cup (as the stated serving size) of ice cream should be determined. § Two different flavors (Strawberry Banana Burst & Watermelon) with identical macronutrient and caloric content (by label) were used for analysis (2 each: n=4). # Product was measured 4 times (2 unprepared, 2 prepared), all data were used for analysis.

