
Figure 2.
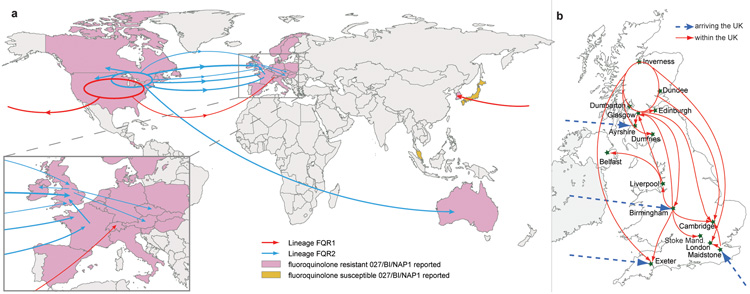
Transmission events inferred for epidemic C. difficile 027/BI/NAP1. a, Global spread of lineages FQR1 (red arrows) and FQR2 (blue arrows) inferred from phylogeographic analysis (Supplementary Fig. 5). Global map demonstrating the countries where fluoroquinolone-resistant (pink) and fluoroquinolone-sensitive (yellow) C. difficile 027/BI/NAP1 has been reported6. Width of the arrow is approximately proportional to the number of descendents from each sub-lineage. b, Inferred arrivals (blue dashed arrows) and transmissions (red arrows) of FQR2 into and within the UK based on phylogeographic analysis (Supplementary Fig. 5) and maximum likelihood phylogeny (Fig. 1b).