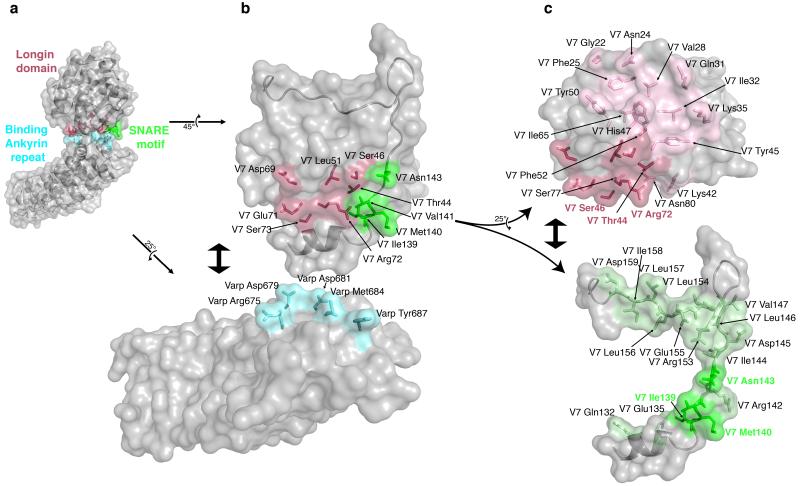
Figure 4. Analysis of the Varp–VAMP7 complex interface.
a Semi–transparent surface representation of the Varp–VAMP7 complex with the underlying backbone structure showing. Residues involved in the interface are shown in ball and stick representation and they and the parts of the protein surfaces they map to are highlighted in colour (VAMP7longin domain in purple, VAMP7SNARE motif in green and Varp in cyan)
b The ‘flipped open’ interaction interface of the Varp–VAMP7 complex. VAMP7 and Varp have been ‘rotated’ and ‘separated’ as shown by the arrows. Side chains involved in the interaction are shown and coloured as in a with only the VAMP7 SNARE motif backbone shown for clarity.
c VAMP7 SNARE motif and longin domain cytosolic domains ‘rotated’ and ‘separated’ as shown by the arrows. Residues involved in the binding to Varp are shown in darker purple (on longin domain) or green (on SNARE motif) and labelled accordingly. Residues involved in the interaction between the VAMP7 longin domain and the SNARE motif are shown in lighter purple or green and labelled in black.

