
Figure 6.
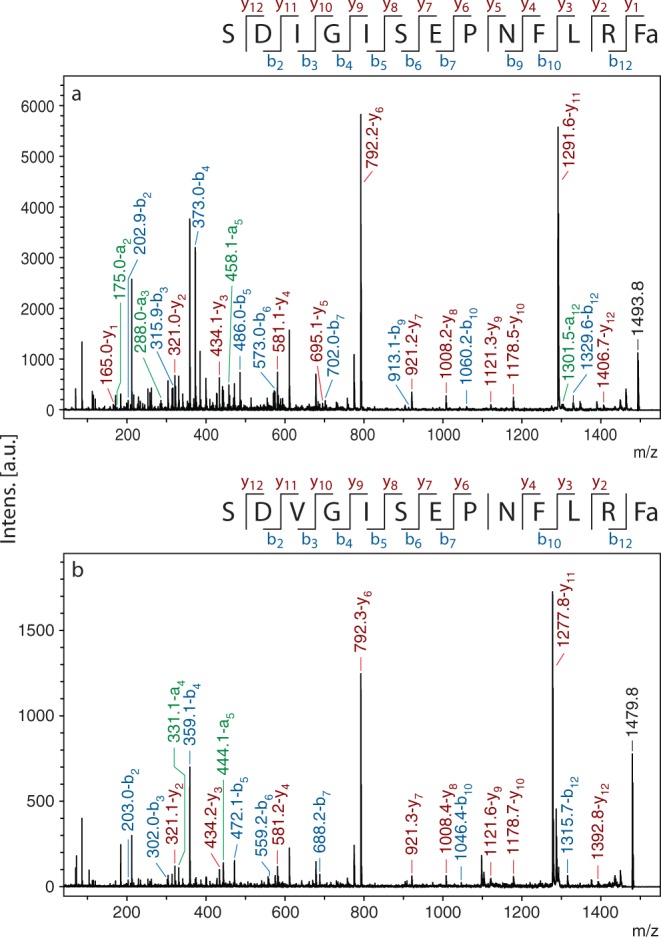
MS/MS spectra of AF11 and AF11-I3V from AVK. Peaks representing a (green), b (blue), and y (red) ions are labeled, and b and y ions are summarized in the sequence at the top of each spectrum. (a) MS/MS spectrum of AF11, m/z 1493.8. (b) MS/MS spectrum AF11-I3V, m/z 1479.8.