Figure 5.
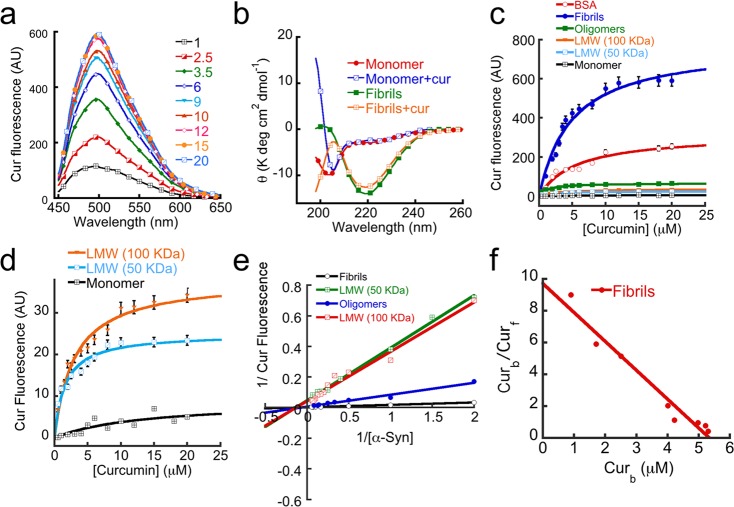
Relative binding of curcumin to different α-Syn species. (a) Curcumin fluorescence spectra of varying concentrations of curcumin (1–20 μM) in the presence of 5 μM preformed α-Syn fibrils. (b) CD spectra of 5 μM α-Syn monomers and fibrils in the presence and absence of 20 μM curcumin. (c) Curcumin fluorescence value at λmax (500 nm) in the presence of different α-Syn species with varying concentrations of curcumin showing maximum curcumin binding for fibrils. (d) Comparative increase in curcumin fluorescence at 500 nm in the presence of 5 μM each of the LMW 50 kDa, LMW 100 kDa and monomer showing increase in curcumin binding according to the oligomer order. (e) Double-reciprocal plots of various α-Syn species. (f) Scatchard plot of the α-Syn fibrils–curcumin complex. Curb and Curf indicate bound and free curcumin, respectively.

