Figure 1.
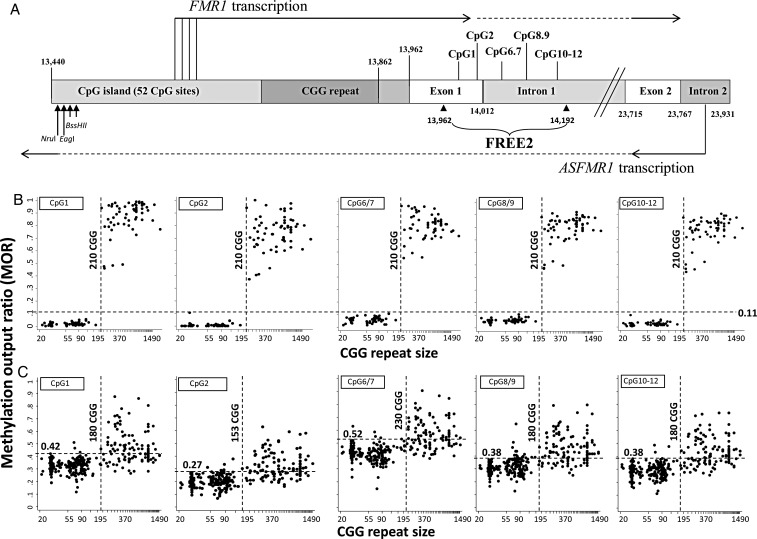
Comparison between CGG size (x-axis) and methylation output ratio (y-axis) within the FREE2 region. (A) Representation of the intron and exon regions 3′ of the FMR1 CGG expansion (sequence numbering from GenBank L29074 L38501) in relation to FMR1 and ASFMR1 transcription start sites (the broken lines indicated spliced out regions), FREE2 and the FMR1 CpG island and methylation-sensitive restriction sites (NruI, EagI and BssHII) analysed using routine fragile X Southern blot testing. A CGG repeat is located within the 5’ (UTR) of the FMR1 gene. ASFMR1 spans the CGG expansion in the antisense direction and is also regulated by another promoter located in the exon 2 of FMR1. The FREE2 region is located downstream of the CGG expansion, with CpG1 and 2 located within the 3′ end of FMR1 exon 1; CpG6/7, 8/9 and 10–12 located within the 5′ end of FMR1 intron 1. (B) 119 males with CGG size ranging between 22 and 2000 repeats. (C) 368 females with CGG size ranging between 21 and 1500 repeats. Note: PM/FM mosaic individuals and ‘high functioning’ unmethylated FM males as determined by methylation-sensitive Southern blot were not included. For females only the size of the smallest size expanded allele is presented on the x-axis. If a FM allele was identified as a smear; the lowest CGG size expanded allele was presented on the x-axis for both FM males and females. The horizontal-broken line represents the maximum MOR value for the control group with CGG<40, with this value indicated above this line, with an exception of CpG6/7 where one control outlier at the MOR of 0.63 was not considered as the maximum control value. The perpendicular-broken line represents the minimum MOR value between 100 and 300 CGG repeats which is above the maximum value of the control group.

