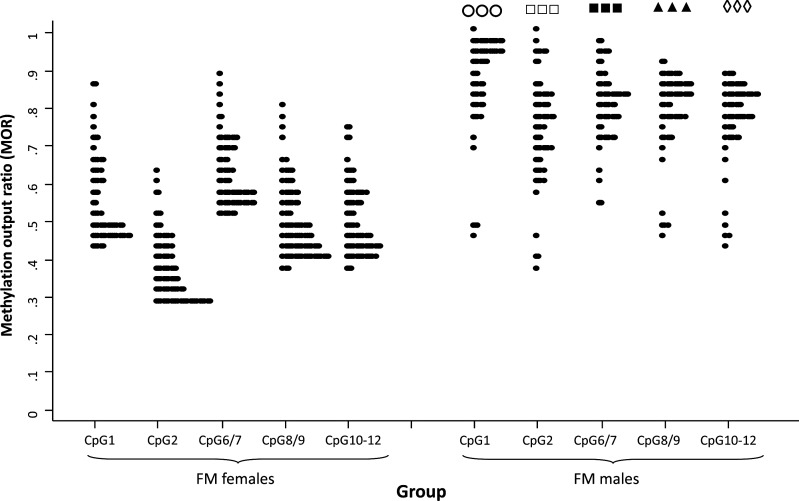
Figure 2.
FREE2 methylation comparisons between FM males and females with the methylation output ratio above the maximum MOR of the control group. CpG1 and 2 are located within the 3′ end of FMR1 exon 1; CpG6/7, 8/9 and 10–12 are located within the 5′ end of FMR1 intron 1. Note: All comparison showed P < 0.001. CpG1—open circles; CpG2—open squares; CpG6/7—closed squares; CpG8/9—closed triangles; CpG10–12—open diamonds.

