Figure 6.
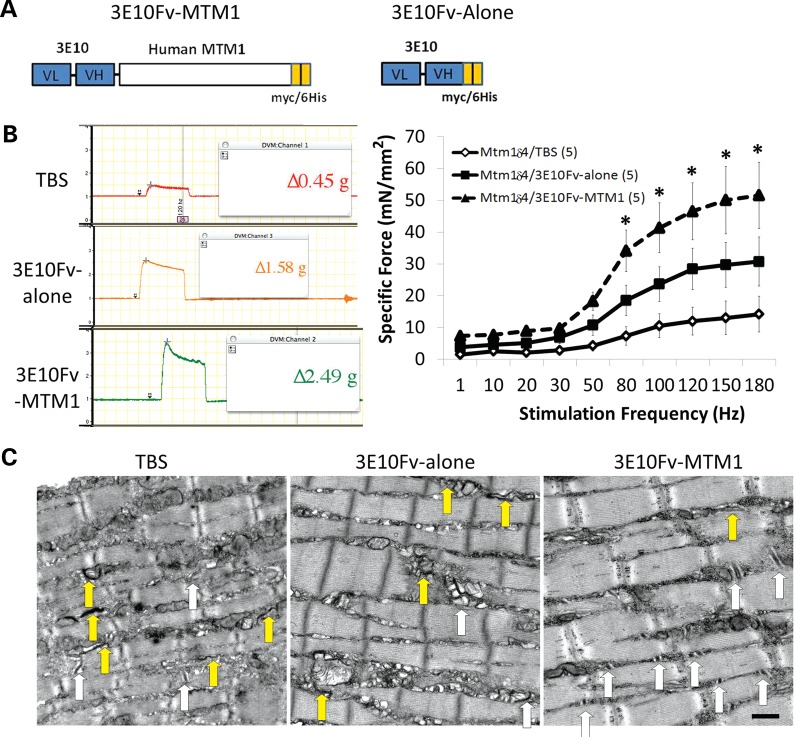
Improvement of functional deficits and ultrastructural abnormalities following intramuscular injection of 3E10Fv-MTM1 into Mtm1δ4 mice. Contractile performance was evaluated in EDL muscles of 6-week-old animals following 2 weeks of intramuscular injections into the tibialis anterior muscle with TBS, 3E10Fv-alone or 3E10Fv-MTM1. (A) Schematic diagrams of 3E10Fv-MTM1 and 3E10Fv-alone fusion proteins illustrating the linked VL and VH chains of mAB 3E10 (blue), full-length human myotubularin (white) and carboxy-terminal myc/6his tags utilized for affinity purification (orange). (B) Representative tracings of tetanic responses recorded at a frequency of 150 Hz depict representative maximum force in each group. Note that the vertical axes of all force tracings are on the same scale. Frequency/specific force relationships depict the force elicited in each group of animals while accounting for individual muscle cross-sectional area when expressing these data. Note that the specific force measurements for TBS-injected EDL muscles are similar to the measurements from uninjected Mtm1δ4 EDL muscles shown in Figure 1. *P < 0.01 when comparing 3E10Fv-MTM1 to TBS injection by two-way ANOVA. (C) Treated animals were evaluated ultrastructurally for the presence of triads, T-tubules and L-tubules, using the same methods described in Figure 3. White arrows identify the triads and yellow arrows identify the longitudinal (L-) tubules that are identifiable in each picture. Bar = 500 nm.

