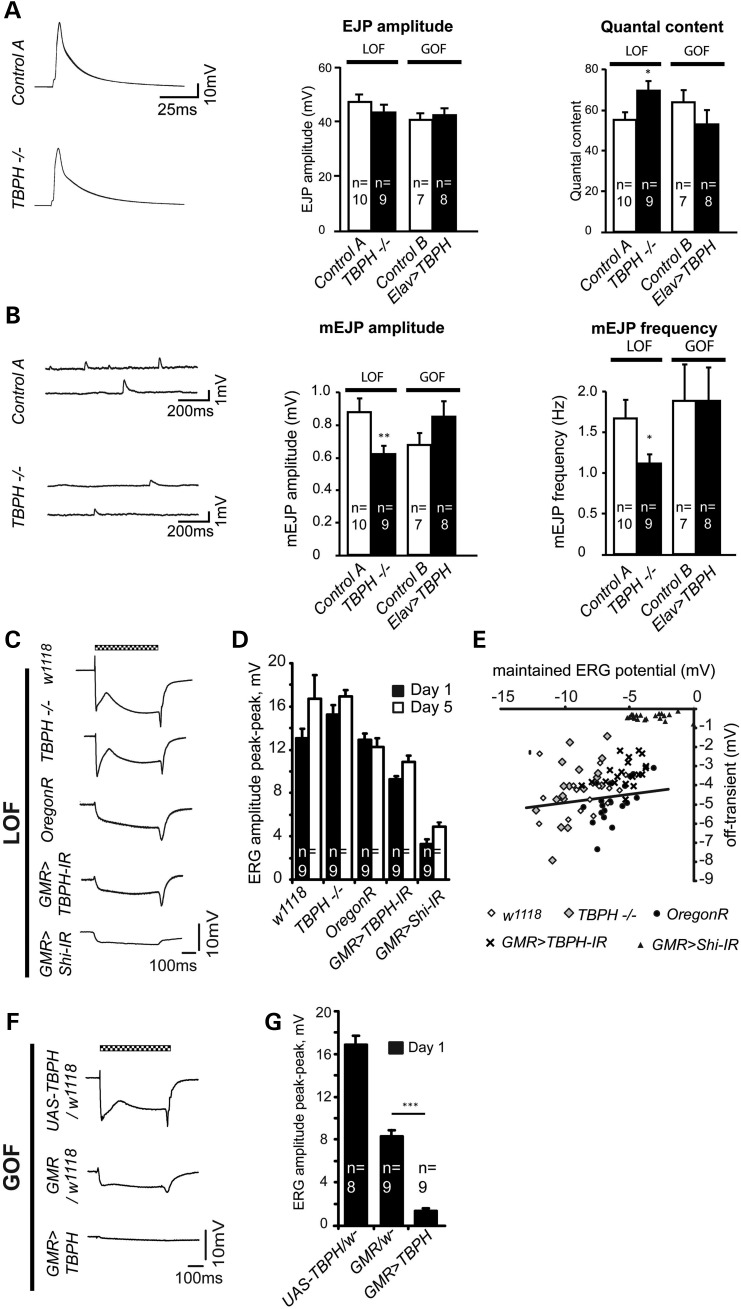
Figure 4.
TBPH dysfunction affects synaptic efficacy. (A) Representative excitatory junction potential (EJP) traces are shown for LOF. EJP amplitudes for TBPHDD96−/− LOF and pan-neuronal ELAV>TBPH GOF flies are not significantly different from the respective controls (control A, w1118/+ and control B, Elav/+), however, quantal content is significantly increased in TBPH mutant larvae. (B) Representative traces of spontaneous neurotransmitter release (mEJP) shown for TBPHDD96−/− LOF. Both the mEJP amplitude and frequency are significantly reduced in TBPH mutant larvae. The mEJP is unaffected in ELAV>TBPH gain-of-function flies (w1118/+, control A; Elav/+, control B). (C) Representative ERG traces of the indicated TBPH LOF conditions. The white-eyed TBPHDD96−/− mutants and w1118 flies show a strong, habituating response, steady maintained response and off-transient. The red-eyed OregonR, GMR>Shibire-IR and GMR>TBPH-IR show a smaller amplitude response; GMR>Shibire-IR flies lack on- and off transients. Chequered bar indicates duration of light pulse. (D) Mean peak–peak amplitude of the ERG from the indicated conditions at day 1 and day 5 timepoints. (E) TBPHDD96−/− mutant and GMR>TBPH-IR have significantly smaller off-transients than the respective eye color-matched controls. The negative GMR>Shibire-IR controls, in which synaptic transmission is blocked, show a severely reduced off-transient. The solid line shows the regression line between off-transient and maintained response for wild-type flies. (F) Representative ERG traces of the indicated TBPH GOF conditions. The UAS-TBPH/+ and GMR/+ flies show a normal amplitude response, the smaller response seen in the GMR/+ flies is due to the darker red pigment. GMR>UAS-TBPH flies have a very small response, with no off/on transients visible. (G) Mean peak–peak amplitude of the ERG from the indicated GOF conditions at day 1 is significantly decreased in GMR>TBPH flies compared with the controls (D, E, n = 9; *P < 0.05, **P < 0.01, ***P < 0.001). Mean and SEM are shown (A, B, D, G).

