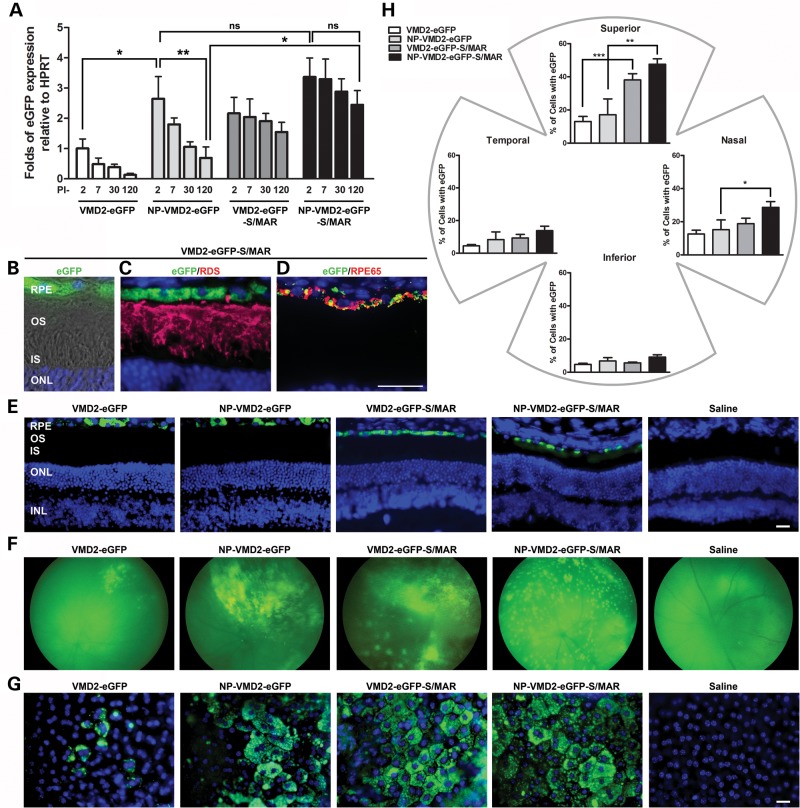
Figure 1.
S/MAR vectors drive retinal gene expression. (A) Quantitative real-time PCR (qRT-PCR) analysis was conducted at PI-2, PI-7, PI-30 and PI-120 on whole eyes from WT animals after P30 injection of the indicated vectors. eGFP levels were normalized to the housekeeping gene HPRT. *P < 0.05 and **P < 0.01 in two-way ANOVA with Bonferroni's post hoc test. All significant pairwise comparisons are shown. PI-2, PI-7 and PI-30 data for VMD2 eGFP and NP-VMD2-eGFP are replotted from (11). Experiments were conducted under the same conditions and by the same person here as in (11), and HPRT values were consistent across timepoints. (B–D) Cryosection taken at PI-120 from an animal injected with VMD2-eGFP-S/MAR. (B) Native eGFP fluorescence, DAPI and Nomarski. (C) IHC of the same eye as (B) showing single planes with eGFP, DAPI and anti-RDS labeling (red). (D) IHC showing eGFP and anti-RPE65 labeling (red). (E) Representative images showing native eGFP fluorescence in the RPE. (F) Fundus images showing the distribution of eGFP expression at PI-120. (G) Native eGFP fluorescence in representative RPE whole mounts at PI-120. (H) eGFP-positive cells at PI-120 were counted in six 20× images from each quadrant. Values were summed and expressed as a fraction of the total number of RPE cells counted (6000–7000 cells counted per eye). *P < 0.05, **P < 0.01 and ***P < 0.001 by one-way ANOVA with Bonferroni's post hoc test. All significant comparisons are shown. n = 3–4 eyes/group for each experiment. Scale bar: B–D, 10 µm; E and G, 20 µm. RPE, retinal pigment epithelium; OS, outer segment; IS, inner segment; ONL, outer nuclear layer; INL, inner nuclear layer.

