Figure 3.

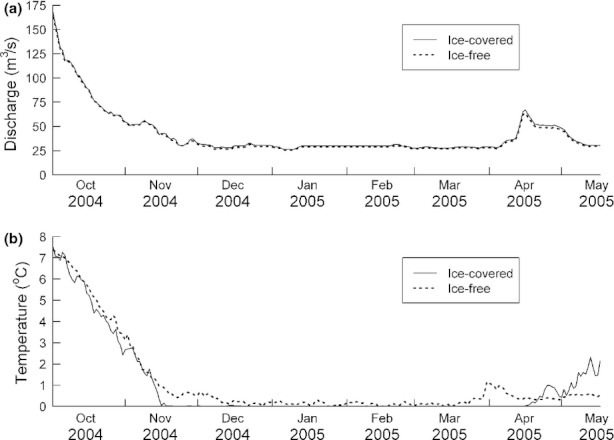
Average daily (a) water discharge (m3s−1) and (b) water temperature (°C) from 1 October 2004 to 15 May 2005 at the ice-covered and ice-free sites in the River Alta. Data were from the Norwegian Water Resources and Energy Directorate.

Average daily (a) water discharge (m3s−1) and (b) water temperature (°C) from 1 October 2004 to 15 May 2005 at the ice-covered and ice-free sites in the River Alta. Data were from the Norwegian Water Resources and Energy Directorate.