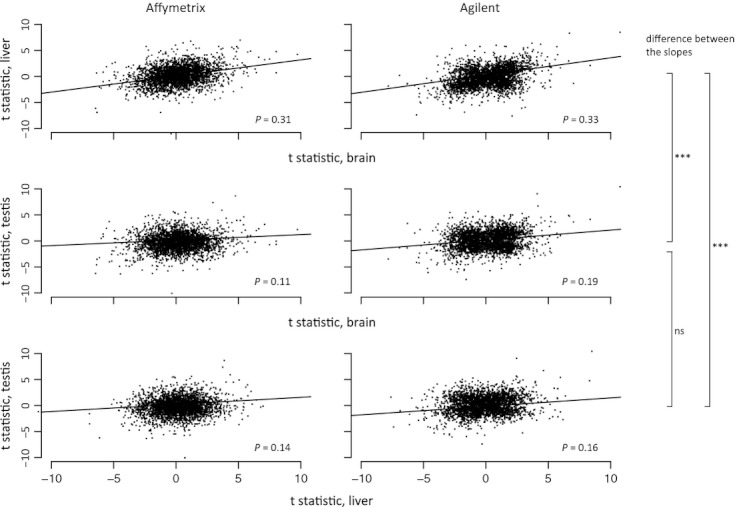
Figure 2.

Spearman's rank correlations of t statistics between pairs of tissues from both populations on both platforms for 2762 genes with equal variance between the populations in both platforms and expressed in all tissues in both platforms. Outliers beyond t statistic smaller than −10 and bigger than 10 were omitted from the graphs. Significance values (test for equality of regression slopes (Dalgaard 2008; Zar 2010)): brain–liver vs brain–testis pAffymetrix = 6.05 × 10⁻¹² and pAgilent = 3.34 × 10⁻⁷; brain–liver vs liver–testis pAffymetrix = 1.41 × 10⁻⁹ and pAgilent=1.14 × 10⁻⁹; brain–testis vs liver–testis pAffymetrix = 0.23 and pAgilent = 0.25.
