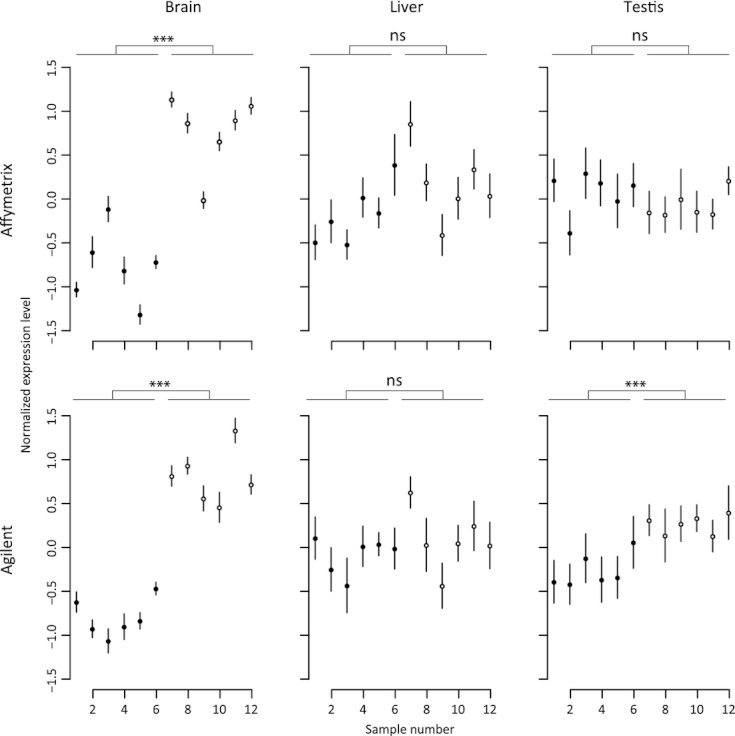
Figure 4.

Hierarchical clustering of mean normalized expression levels for 113 genes expressed in all tissues and differentially expressed only in brain in each sample. Columns for liver and testis (both for n = 15 genes in both platforms) show mean normalized expression level of these genes in each sample in the respective tissue. Filled circles (samples 1–6): German population; empty cicrles (samples 7–12): French population. Error bars are standard error of the mean. Significance values (two–sided t-test without assuming equal variance, comparing mean normalized expression levels between the populations): pAffymetrixBrain = 7.37 × 10⁻⁵, pAffymetrixLiver = 0.16, pAffymetrixTestis=0.25; pAgilentBrain = 2.75 × 10⁻⁶, pAgilentLiver = 0.31, pAgilentTestis = 3.7 × 10⁻⁴. Please note that the pAgilent Testis was significant only in the presented case. Clustering calculations performed for liver and testis otherwise produced nonsignificant values.
