
Table 2.
Models of spatial genetic structure and estimation of effective metapopulation size (meta-Ne) or the size of an idealized population with the same rate of inbreeding observed in the subdivided population under study
| Name | Model* | Expectations | Reference |
|---|---|---|---|
| Island | 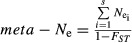 |
meta-Ne >  unless FST = 0; inequality increases with FST (divergence) unless FST = 0; inequality increases with FST (divergence) |
Wright (1943) |
| Stepping stone (circular) | 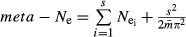 |
meta-Ne >  ; inequality increases with decreasing average immigration rate ( ; inequality increases with decreasing average immigration rate ( ) ) |
Maruyama (1970) |
| Neighborhood (linear) | 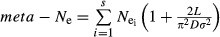 |
meta-Ne >  ; inequality increases with increasing length of the habitat (L), but decreases with increasing population density (D) ; inequality increases with increasing length of the habitat (L), but decreases with increasing population density (D) |
Wright (1946) Maruyama (1971) |
| Interdemic | 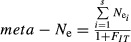 |
meta-Ne <  ; inequality increases with metapopulation inbreeding ; inequality increases with metapopulation inbreeding |
Nunney (1999) |
| Spatiotemporal | 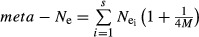 |
meta-Ne >  ; inequality increases with the average number of migrants per generation ; inequality increases with the average number of migrants per generation 
|
Kobayashi and Yamamura (2007) |
*
Metapopulation parameters: s = number of subpopulations/ponds;  = average subpopulation Ne; FST = global genetic divergence among subpopulations;
  = average immigration rate; D = linear population density (individuals/km); L = length of habitat (km); σ2 = variance of dispersion distance; FIT = coefficient of global (metapopulation) inbreeding.