
Figure 1.
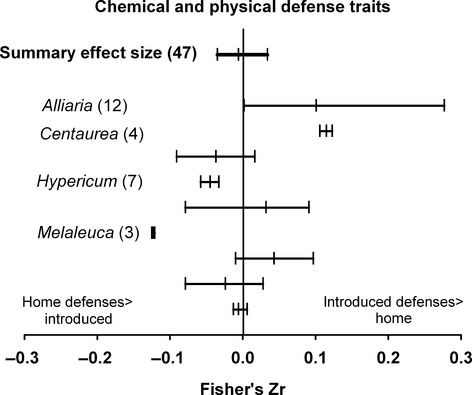
Chemical and physical defense traits in introduced- versus home-range invasive plant species. The summary effect which includes all contrasts is at the top of the graph. Effects are grouped by plant species, and species in which there was a significant effect are indicated by genus name on the graph. Numbers in parentheses indicate the number of contrasts of introduced- versus home-range plants summarized by each effect. Error bars indicate bias-corrected 95% confidence intervals, and error bars that overlap the y-axis indicate an effect which is not statistically significant (i.e., there is no significant difference between home and introduced ranges for this effect).