
Figure 2.
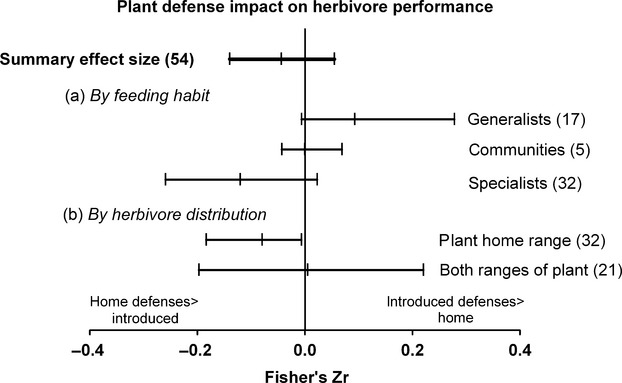
Plant defenses evaluated via herbivore performance, herbivores fed on introduced- versus home-range plants. The summary effect which includes all contrasts is at the top of the graph. Effects are categorized by a) herbivore feeding habit or degree of specialization, or by b) herbivore distribution in the range of the plant species evaluated. Numbers in parentheses indicate the number of contrasts of introduced- versus home-range plants summarized by each effect. Error bars indicate bias-corrected 95% confidence intervals, and error bars that overlap the y-axis indicate an effect which is not statistically significant (i.e., there is no significant difference between home and introduced ranges for this effect).