
Figure 4.
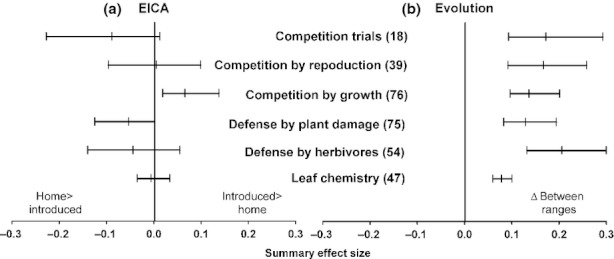
Meta-analysis of plant defense and competitive traits showed no broad support for a) EICA hypothesis, but general support for b) evolution of all traits in the introduced range of invasive plant species. Panel (a) shows all EICA summary effect sizes, and panel (b) shows all summary effect sizes evaluating the hypothesis that evolution occurs with invasion. Numbers in parentheses indicate the number of contrasts between home and introduced ranges of invasive plant species for each class of trait. Note that all effect sizes are Fisher's Z-transformations, except for the competition trial effect sizes, which are natural logarithm-transformed response ratios. Error bars indicate bias-corrected 95% confidence intervals, and error bars that overlap the y-axis indicate an effect which is not statistically significant (i.e., there is no significant difference between home and introduced ranges for this effect).