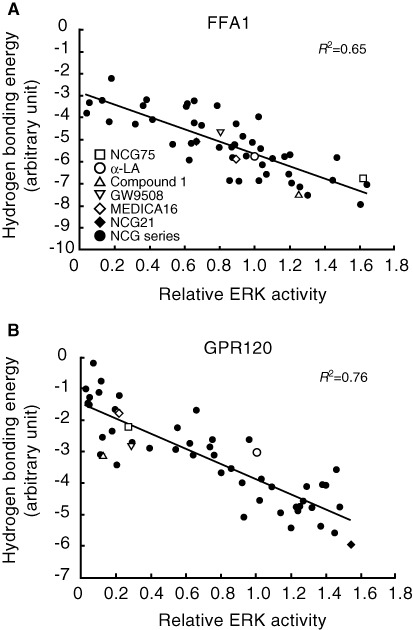
Figure 1.

Correlation between the relative ERK activity and the calculated hydrogen bond energy of interaction based on modelling. The straight line represents (A) the line y=−2.75 ×−2.90 (FFA1 receptor) and (B) y=−2.49 ×−1.37 (GPR120). The coefficient of determination (R2= 0.65, FFA1 receptor and 0.76, GPR120) reflects a high correlation between the hydrogen bonding energy and the relative ERK activity.
