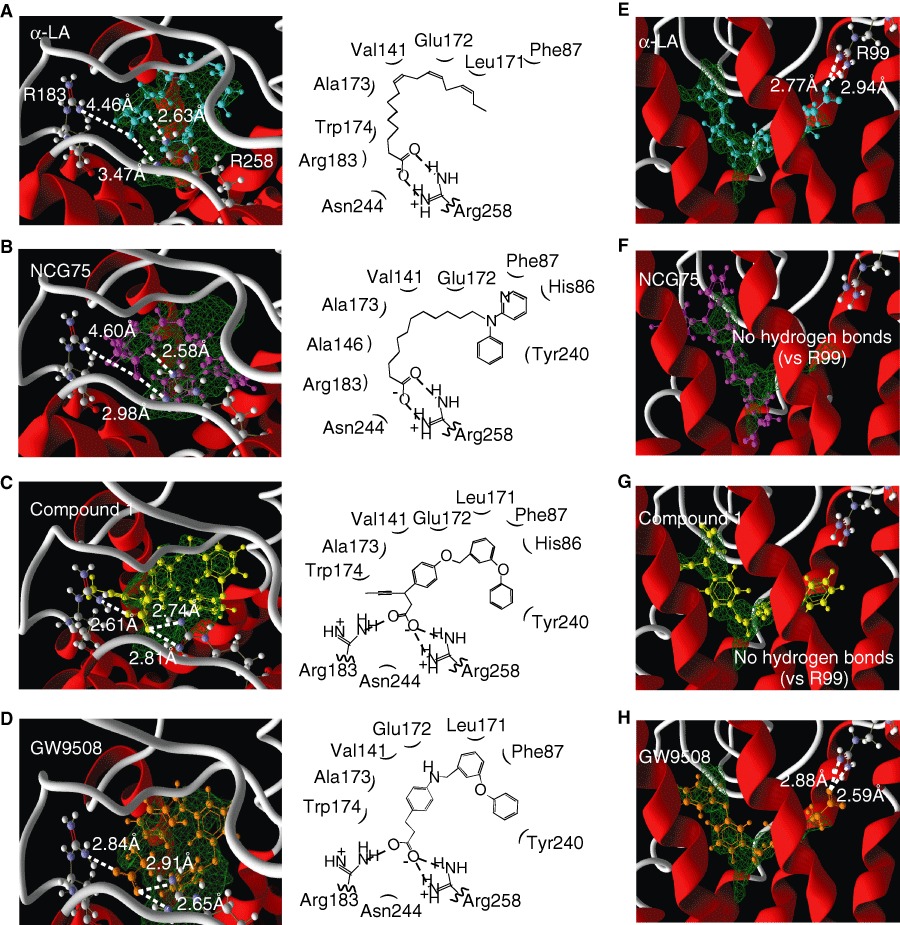
Figure 4.

The FFA1 receptor and GPR120 homology models docked with each compound tested (A–D, for FFA1 receptor; E–H, for GPR120). α-LA (A,E), NCG75 (B,F), compound 1 (C,G) and GW9508 (D,H) were docked into the binding pocket of the FFA1 receptor or the GPR120. Cyan, α-LA; magenta, NCG75; yellow, compound 1; orange, GW9508; green: the binding pocket predicted by the Molegro cavity detection algorithm. The dashed lines indicate the distances between the oxygen of the carboxylate groups of the compounds and the guanidine nitrogen of arginine residues.
