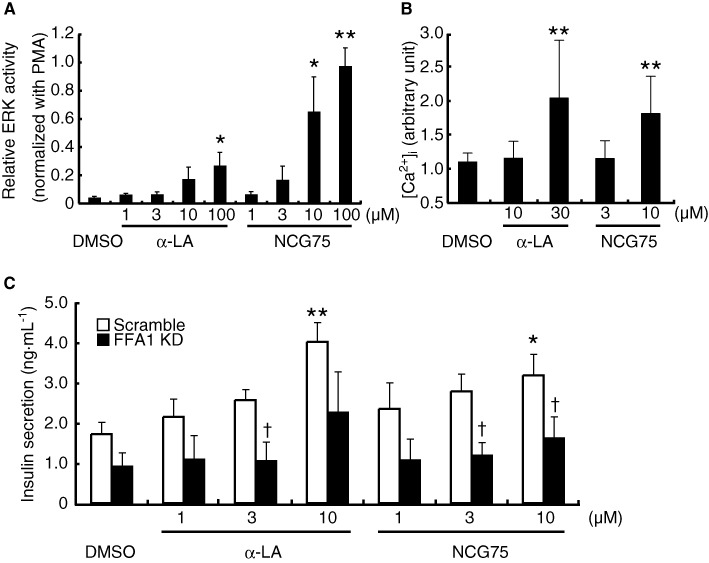
Figure 6.

Effect of NCG75 in MIN6 cells. (A) Relative ERK activity was measured in MIN6 cells, as described for Figure 2. Results are means ± SEM of five independent experiments. *P < 0.05, **P < 0.01, significantly different from control (DMSO). (B) The maximum [Ca2+]i response induced by the indicated compounds between 0 and 10 min is shown. Results are means ± SEM of three independent experiments. The data were normalized against the maximum response observed in the presence of DMSO. *P < 0.05, **P < 0.01, significantly different from control (DMSO). (C) Effect of siRNA for the FFA1 receptor (FFA1 KD) on insulin secretion in MIN6 cells was measured after treatment with compounds at 1–10 µM for 120 min at 37°C in Krebs buffer that contained 25 mM glucose. Results are means ± SEM of five independent experiments. *P < 0.05, significantly different from control (DMSO); †P < 0.05, significantly different from control (scramble) siRNA.
