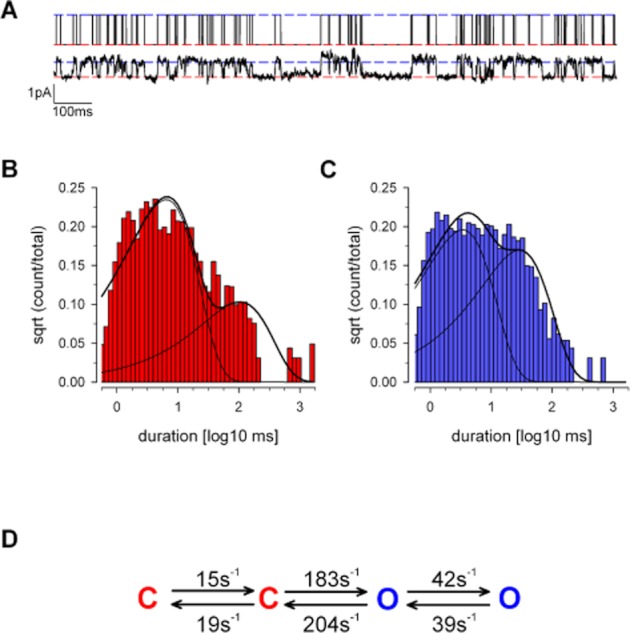
Figure 2.

Kinetic analysis of the low conductance cation channel. Kinetic analysis of the ENaC/Deg-like low conductance was performed under cell-attached patch conditions. Li+ was included in the patch-pipette and served as the charge carrier (Solutions: Table 1). (A) Upper panel, the SKM idealized record from this trace (see Methods). Lower panel, raw single channel trace at −80 mV, baseline corrected. (B) An example patch closed-time distribution superimposed with a bi-exponential PDF calculated from panel D: (τ1, area): 5.9 ms, 0.83, (τ2, area): 94.5 ms, 0.17. Mean: 21.0 ms. (C) An example open-time distribution, again fit with a bi-exponential PDF calculated from panel D: (τ1, area): 3.1 ms, 0.5, (τ2, area): 26.5 ms, 0.46. Mean: 13.8 ms. (D) Schematic of our best fit kinetic model, full data in text (Table 3). Throughout this figure, red is used to denote closed states, and blue denotes open state.
