Figure 5.
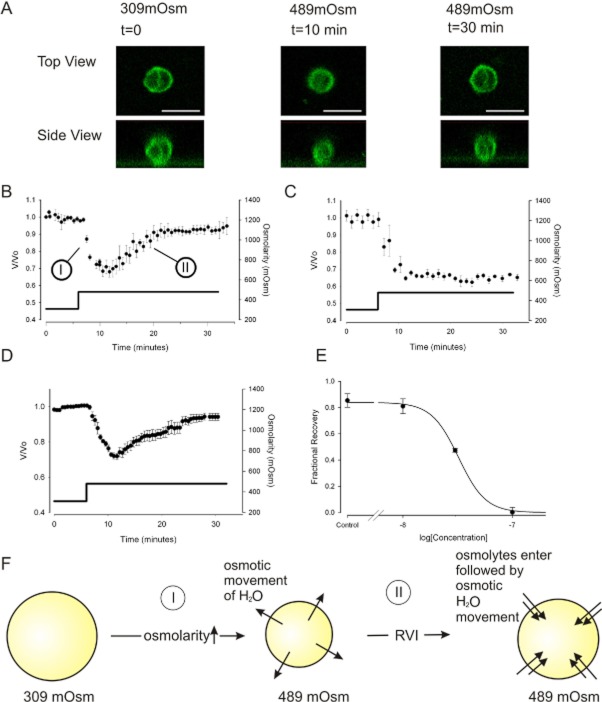
RVI is retained in lithium, but sensitive to low concentrations of benzamil. (A) Confocal images showing changes of cell volume with time. The top panels show the chondrocyte from above (X–Y plane), and the lower panels show the reconstructed cell view from the side (Z–X plane). In order to capture relatively rapid volume changes, scan resolution was set to a low value (31 Z layers per time slice). These images were necessary to verify that cells were approximately spherical (please see Methods: Equation 1). 60× objective scale bar 20 μm. (B) Under control conditions, when cells are incubated in 309mOsm physiological saline (Table 1) then exposed to hypertonic solutions (489mOsm), they first shrink passively as water leaves the cell via osmosis (marked ‘I’). They then swell through the process of RVI, eventually returning to the starting volume (RVI indicated by ‘II’). Osmolarity was increased with addition of sucrose. Not all cells underwent RVI. We use a two-exposure protocol. Only those cells that exhibited RVI on the first exposure to hypertonic challenge were then used for these experiments. The second exposure either contained benzamil or further control vehicle solution, mean of eight cells. (C) The same protocol as that used in panel B, but with the presence of 100 nM benzamil; RVI is inhibited. Mean of five cells. (D) RVI protocol with extracellular Na+ replaced by Li+. For (B) to (D) solid filled markers indicate data points and the solid line (and y-axis on the right) indicates the osmolarity. (E) Concentration inhibition curve for inhibition of RVI by benzamil. Five cells per concentration. Data are represented as fractional recovery from the theoretical maximum shrinkage (0.63 = 309/489) and fit with Equation 3, where R is fractional recovery, m was 0.84 ± 0.2, h is 3.5 ± 0.9 and pD2 =7.5 ± 0.01. (F) Schematic of our working model for RVI, with phases ‘I’ and ‘II’ indicated.

