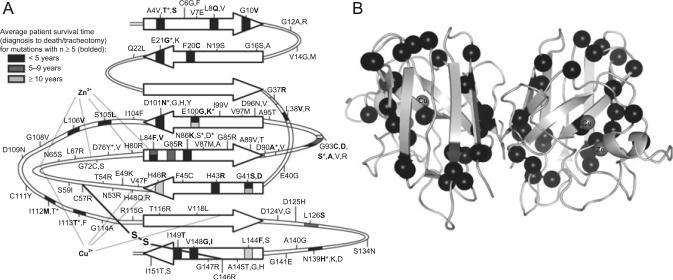
Fig. 3.
Location of FALS-causative mutations on the SOD1 structure. (A) Map of SOD1 secondary structure showing locations of FALS missense mutations, residues that coordinate Cu2+ (His-46, His-48, His-120, His-63) and Zn2+ (His-63, His-71, His-80, and Asp-83) ions, and the intramolecular disulfide bridge. Arrows indicate β-strands. Epidemiological data were taken from Refs. 45,60,70–73; mutations with survival data for at least five patients are bolded, and the residue position is shaded to indicate the corresponding average survival time. For positions with more than one n≥5 mutation, the upper color corresponds to the first mutation listed. (B) Crystal structure (PDB code 1spd) of fully mature (metal-bound, disulfide-intact) homodimeric SOD1 with positions of aggressive (survival time <5 years) mutations indicated by black spheres.

