
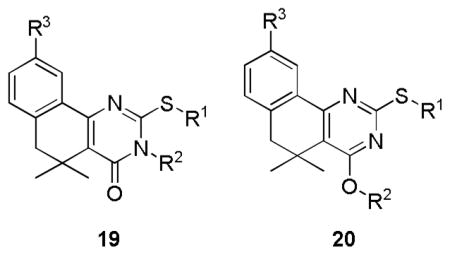
Table 4.
Effect of N-vs. O-alkylation on GAS-SK inhibition and metabolic stability.
| ||||||||
|---|---|---|---|---|---|---|---|---|
| No. | R1 | R2 | R3 | 5 μM SK T/Ca | 50 μM SK T/Ca | 50 μM Growth T/Cb | IC50 (μM) | MLM t1/2 (min)c |
| 19a | MeOCH2CH2 | 4-MeOPhCH2CH2 | H | 0.71 ± 0.40 | 0.61 ± 0.32 | 0.97 ± 0.07 | 9.4 | |
| 20a | MeOCH2CH2 | 4-MeOPhCH2CH2 | H | 0.46 ± 0.37 | 0.24 ± 0.15 | 1.00 ± 0.09 | 5.5 ± 0.7 | 45.1 |
| 19b | Et | CF3CH2 | MeO | 0.78 ± 0.36 | 0.49 ± 0.17 | 1.01 ± 0.04 | 3.0 | |
| 20b | Et | CF3CH2 | MeO | 0.51 ± 0.20 | 0.38 ± 0.23 | 0.89 ± 0.02 | 45.5 | |
| 12a | Et | Allyl | MeO | 0.10 ± 0.06 | 0.07 ± 0.02 | 0.73 ± 0.07 | 1.3 ± 0.6 | 2.3 |
| 20c | Et | Allyl | MeO | 0.89 ± 0.33 | 0.68 ± 0.39 | 0.96 ± 0.02 | 8.3 | |
a
Ratio of A405 of SK-cleaved substrate in GAS culture treated with the indicated concentration of test compound divided by A405 of DMSO control (see Section 5.1.1). Values are the mean of at least three experiments ± standard deviation.
b
Ratio of OD (600 nm) for growth of GAS in the presence of test compound divided by DMSO control. Values are the mean of at least three experiments ± standard deviation.
c
Half-life of parent compound during incubation with mouse liver microsomes.