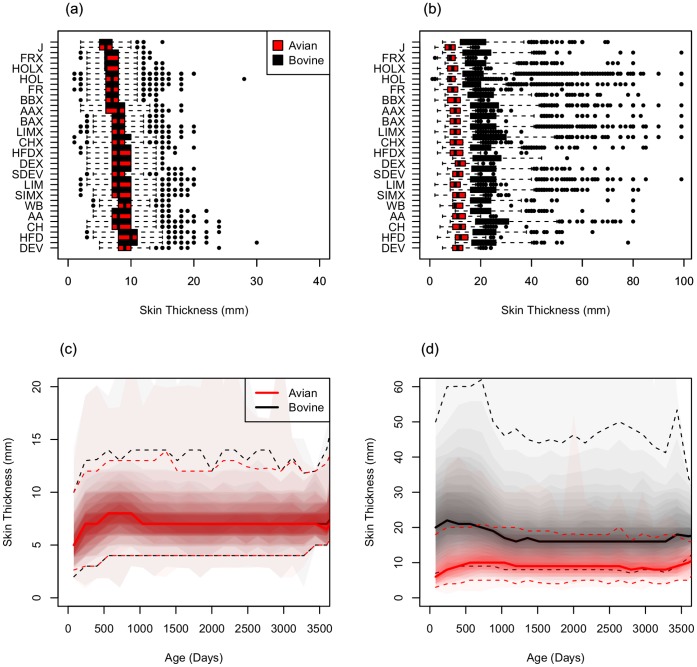
Figure 1. Recorded skin size measurements for reactor animals in VeBus.
(a) Distribution of first avian (a1) and bovine (b1) measurements stratified by breed for all reactor animals recorded with VeBus and ordered by increasing median value; (b) Distribution of second avian (a2) and bovine (b2) measurements stratified by breed for all reactor animals recorded with VeBus; (c) Age profile of first avian (a1) and bovine (b1) measurements for all reactor animals in VeBus; (d) Age profile of second avian (a2) and bovine (b2) measurements for all reactor animals in VeBus. Given the variability in recorded measurements summary measures are potentially misleading. To demonstrate this variability we plot age profiles as a shaded density strip where the intensity of shading is proportional to the probability of a value at that point [44]. Median (solid lines) and upper and lower 95% ranges (dashed lines) are indicated.

