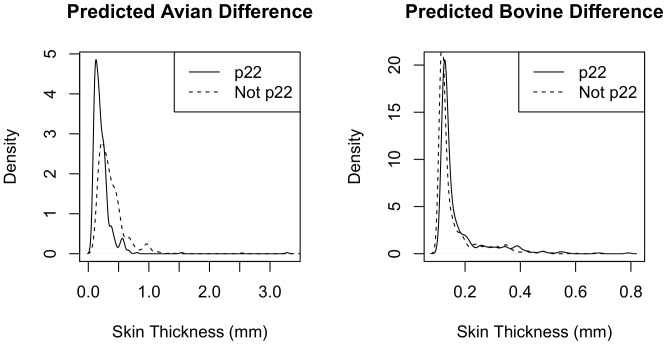
Figure 2. Predicted effect of ‘22’ genotype on the swelling induced by avian and bovine tuberculin challenges.
Swelling size is taken as the difference between the initial measurement, taken immediately following injection, and the final measurement, taken after the prescribed 72 hour time delay that allows an immune response to occur (hereafter = ‘difference’). This controls for skin thickness differences between animals. The graphs show the predicted impact of the ‘22’ parameter (0 = not ‘22’, 1 = ‘22’) on the avian (da, left) and bovine (db, right) differences. Predicted values are calculated from the respective zero-inflated regression models da ∼ age + a1 + p22, db ∼ age + b1 + p22 described within the main text (summarised in Tables 3 and 4). The distribution of predicted values with (solid line) and without (dashed line) the ‘22’ genotype are compared as smoothed density curves. No effect was found for the bovine differences but the model predicts a smaller avian difference (da) when among animals with the ‘22’ genotype.

