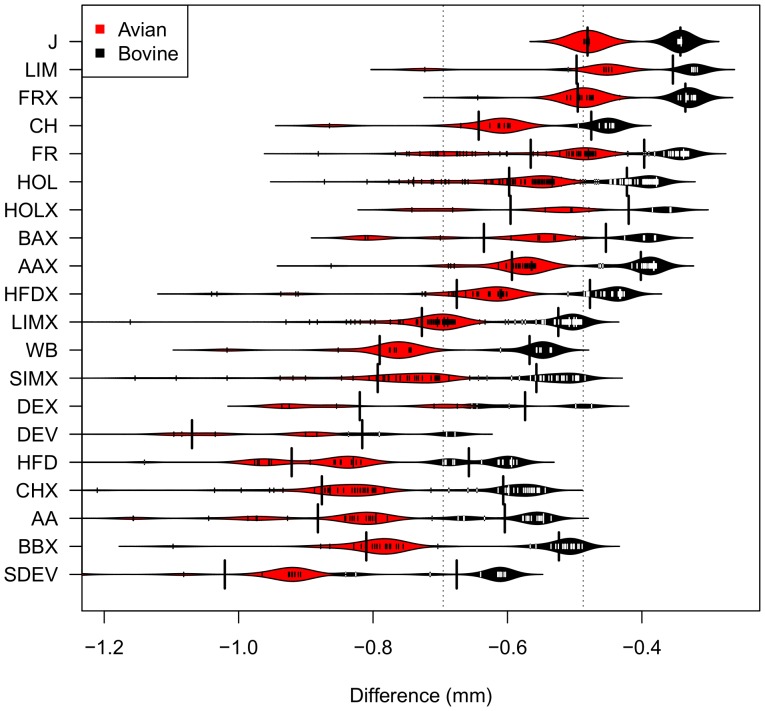
Figure 3. Predicted effect of ‘22’ genotype on second avian (a2, red) and second bovine (b2, black) measurements.
The predicted impact of the ‘22’ parameter (0 = not ‘22’, 1 = ‘22’) on the second avian and second bovine swelling size measurements within our study population is summarised as a ‘beanplot’. The solid envelope represents the smoothed density kernel for the predicted values. Actual values are over-plotted as solid lines and the vertical dotted lines indicate the mean effect sizes across all breeds for the two measurements. Predicted values are calculated from the two Poisson regression models: a2 ∼ p22 + breed + age; b2 ∼ p22 + breed+age (Tables S2, S3).

