
Figure 2.
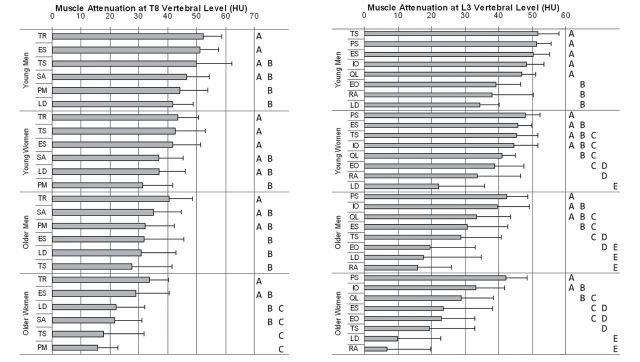
Mean muscle attenuation (Houndsfield units, HU) by muscle within age–sex groups at T8 (left) and L3 (right) levels of the trunk. Muscles are arranged in descending order by attenuation within each age–sex group, and error bars show +1 SD. Within each age–sex group, groups of muscles marked by the same letter do not have significantly different attenuation from each other, and thus muscles not marked by the same letter are significantly different (p < .05). See Figure 1 for definitions of muscle abbreviations.