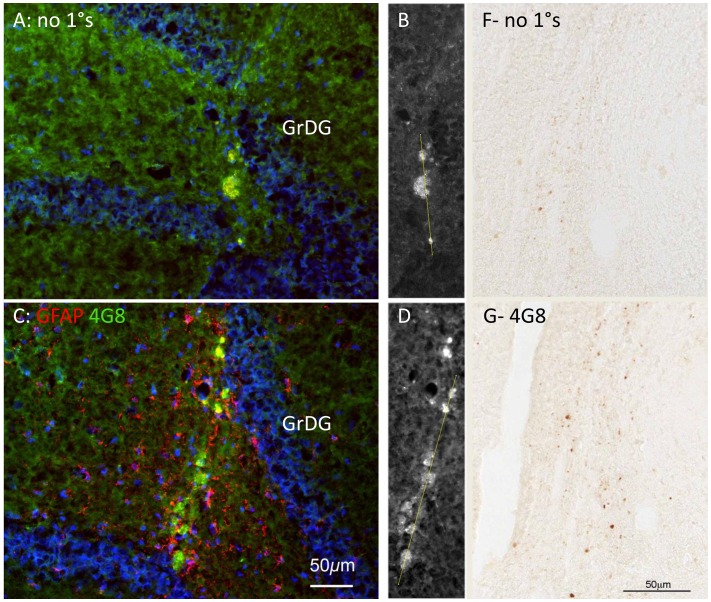
Figure 3. Analysis of antibody-specific fluorescence vs. autofluorescence.
A, C: Neighbouring sections through a needle track 30 days after the lesion. In A, no primary antibodies were used; these are negative controls. In C, antibodies for GFAP (red) and APP/Aβ (green) were used. Exposure times, excitation intensities and all other settings were held constant between A and C. Scale bar in C also applies to A, B and D. Blue fluorescence is bisbenzimide staining of nuclear DNA. B, D: The green fluorescence in A and C is shown in white. Sample lines used for the analysis in Figure 4 are shown, traversing the fluorescent bodies. F, G: Neighbouring sections through a needle track 30 d after the lesion, showing endogenous peroxidase activity in negative control material; and specific labelling with the 4G8 antibody (which labels APP and Aβ) along the needle track. Scale bar in G also refers to F.

