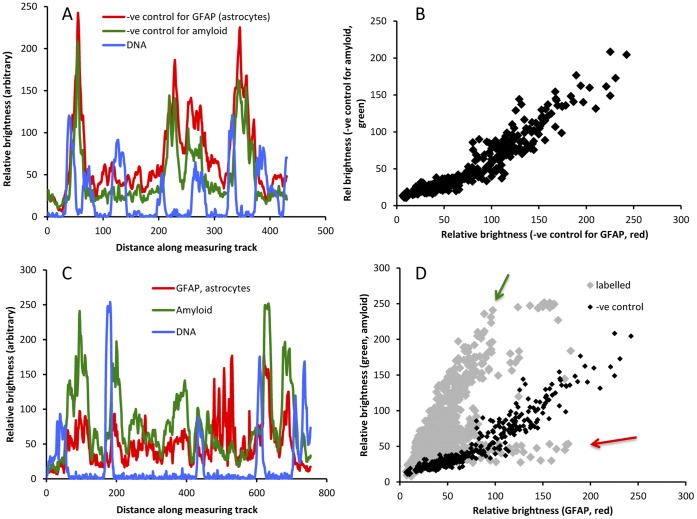
Figure 4. Analysis of antibody-specific fluorescence vs. autofluoresence.
A, B: A shows the variation of red, green and blue fluorescence in negative control sections (along the line shown in Figure 3B). The blue fluorescence is bisbenzimide labelling of nuclear DNA; the red and green fluorescence is autofluorescence. B shows that red and green fluorescence levels co-vary. C, D: C shows the variation of red, green and blue fluorescence in the section in Figure 3C, along the line shown in Figure 3D. This material was labelled for GFAP (red), amyloid (green) and nuclear DNA (using bisbenzimide). D shows the red vs green plot for points along the line in Figure 3D. The dark points reproduce the co-variance seen for negative control material in B. The red and green arrows indicate points that show high red fluorescence (GFAP) and high green fluorescence (amyloid).

