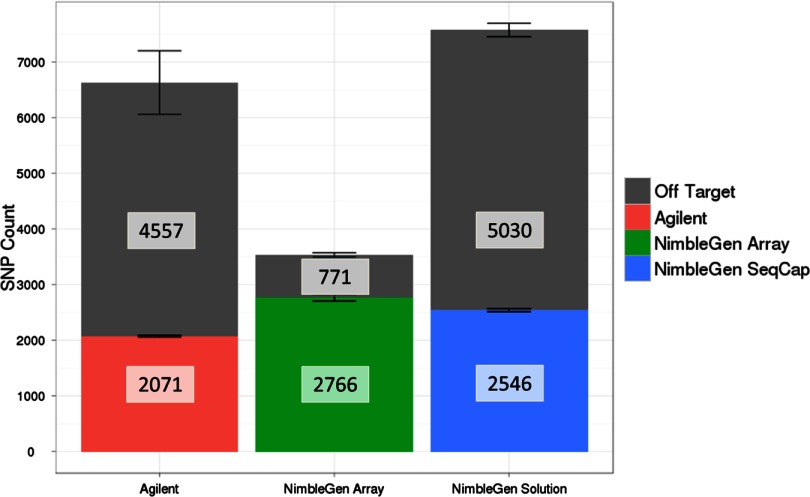
FIGURE 11.
SNPs found for each platform. This histogram shows the number of SNPs found for each platform in the entire 3.5-Mb targeted region, separated by those on-target and off-target. Reads from replicates for each platform were pooled prior to SNP detection. The variation by replicate is shown by bars at the top of each stacked histogram. The total number of SNPs found is boxed within each histogram. SNP counts given are the average over the four sets for each company (two replicates at each sequencing site).

