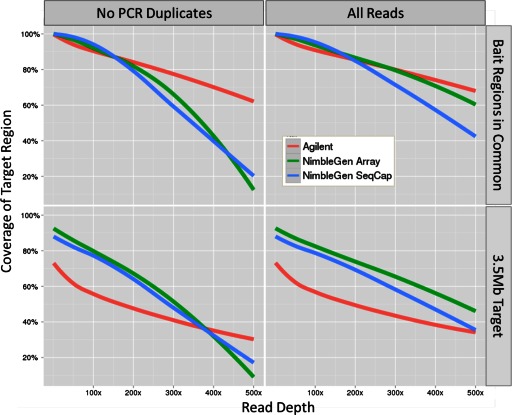
FIGURE 4.
Sensitivity: percent coverage of 3.5-Mb targeted region and bait region for each platform. This chart shows how well the targeted region is covered for read depths from 1× to 500×. PCR duplicates were removed for the plots on the left column and retained for the plots on the right right column. The upper row shows coverage for only the baited regions in common between the two platforms, and the lower row shows coverage for the entire 3.5-Mb targeted region.

