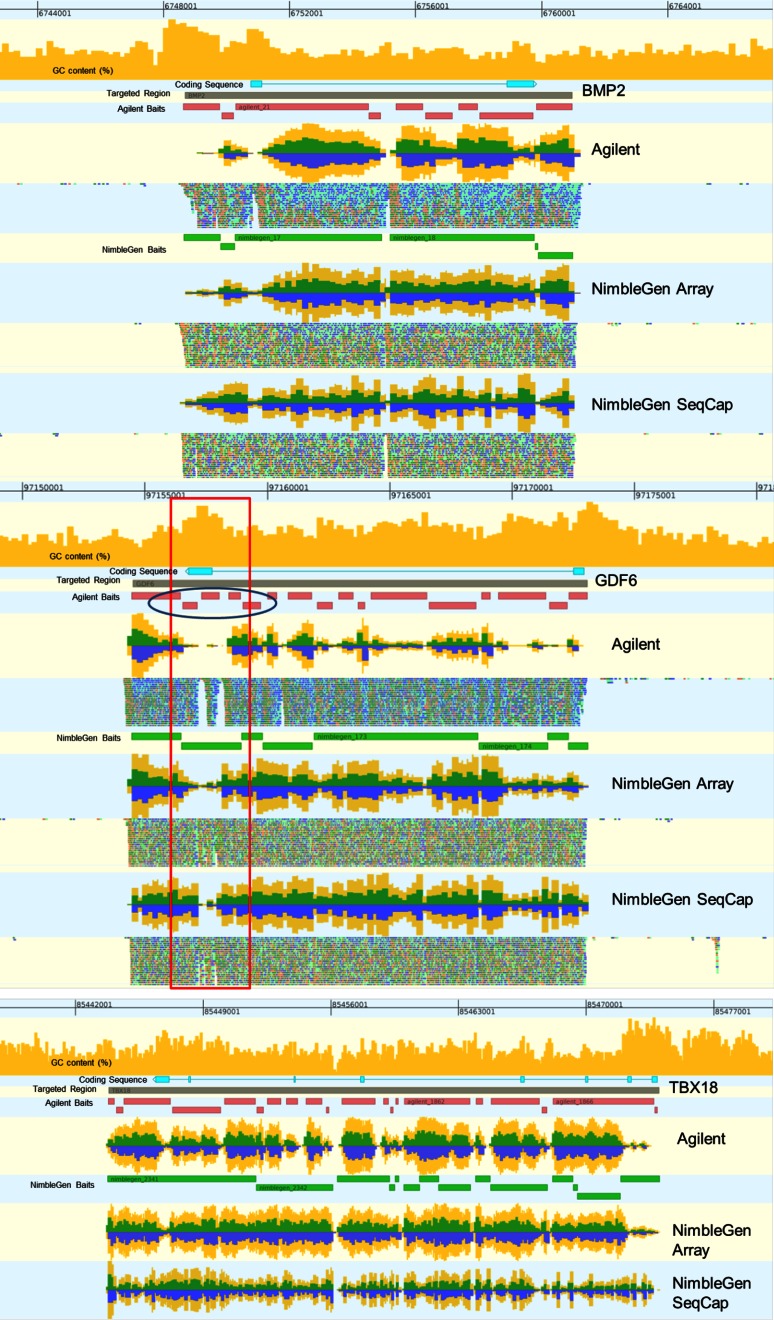
FIGURE 6.
Alignment of reads from each platform near targets bone morphogenetic protein 2 (BMP2), growth differentiation factor 6 (GDF6), and T-box 18 (TBX18). These alignments show GC content of the genomic region, coding sequence, targeted regions, and bait regions for each platform for a given replicate. Percent GC content for the DNA sequence is represented by an orange histogram at the top of the alignment view, ranging from 0 to 100% on the y-axis. The blue track represents the coding sequence for a gene. The gray track represents the targeted region. Red tracks show Agilent-baited regions, and green tracks show the NimbleGen-baited regions. Coverage plots are included for all three targets for each technology, and aligned reads themselves are included for BMP2 and GDF6. Coverage plots are represented by histograms showing the relative per-base coverage for that region on the y-axis. Yellow bars represent the sum of the “+” and “−“ strand coverage; green bars represent the + coverage; and blue bars represent the − strand coverage. For the BMP2 and GDF6 plots, reads aligning to the + strand are in green, and reads aligning to the − strand are in blue. A high GC region is boxed in red, and its effect on the Agilent bait design is circled in blue.

