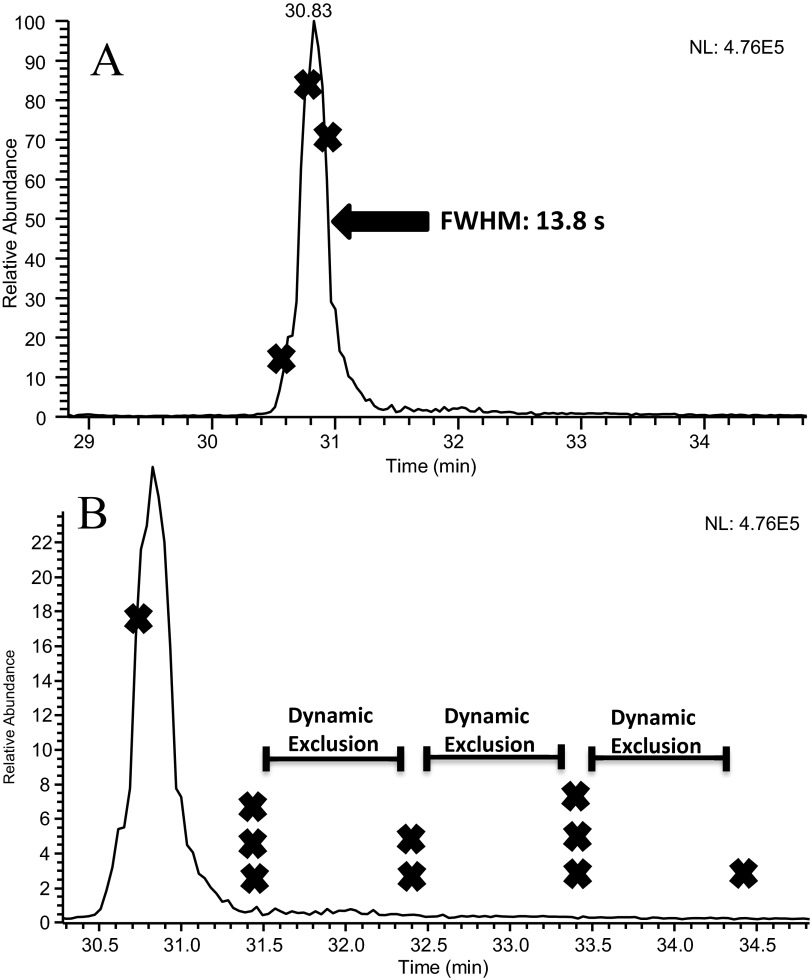
FIGURE 3.
(A) An extracted ion chromatogram and (B) a magnification of this chromatogram obtained from the LC-MS/MS analysis of the BSA tryptic peptide LFTFHADICTLPDTEK. Data were collected using slow-gradient conditions, which included a 0.2 × 50-mm porous-particle column operated at 4 μL/min. An “X” on the chromatogram indicates each location that a MS/MS spectrum was collected for this peptide. A superimposed timescale for the application of dynamic exclusion is also shown.

