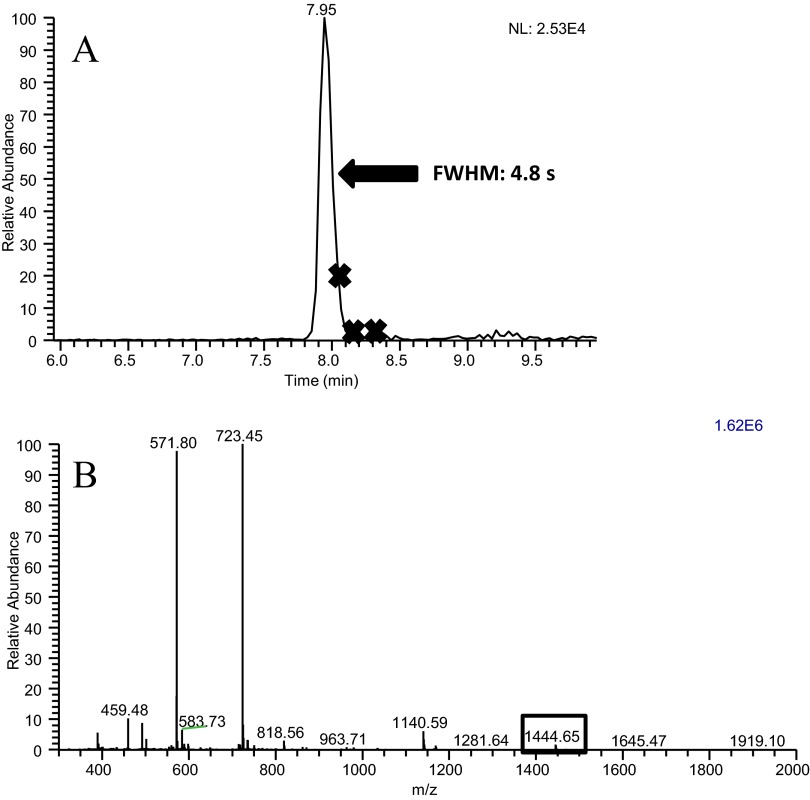
FIGURE 6.
(A) The extracted ion chromatogram for BSA peptide YICDNQDTISSK, obtained with the fast-gradient conditions. An X on the chromatogram indicates each location that a MS/MS spectrum was collected for this peptide. (B) A mass spectrum collected during the elution of peptide YICDNQDTISSK, showing that other ions, several of which had higher abundance, were present along with the ion of interest at m/z 1444.65.

