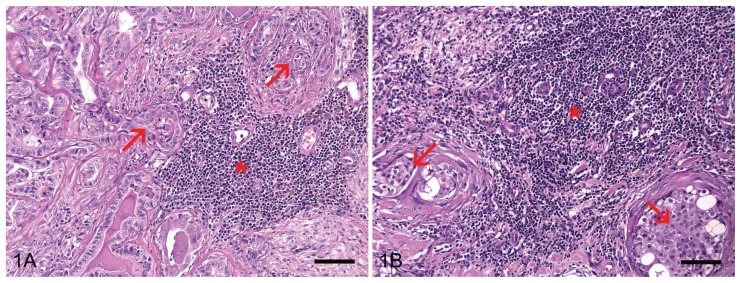
Figure 1.
Lymphocyte infiltration classified according to morphologic analysis. A — Inflammatory cells (asterisk) moderately infiltrate the stroma near the tumor cells (arrows). The degree of lymphocyte infiltration is 2. B — High-density lymphocyte infiltration (asterisk) around tumor nests (arrows). The degree of lymphocytic infiltration is 3. Hematoxylin and eosin. Bar = 70 μm.

