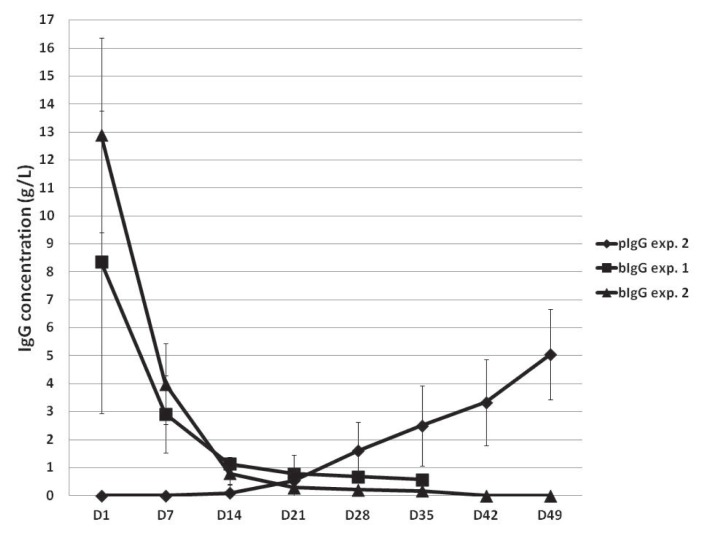
Figure 2.
Plasma concentrations of bovine and porcine immunoglobulin G (bIgG and pIgG) in the SF-pCD pigs in experiments 1 and 2. Squares indicate mean values for experiment 1. Triangles indicate mean values for bIgG and diamonds mean values for pIgG in experiment 2. The vertical lines represent standard deviations.

