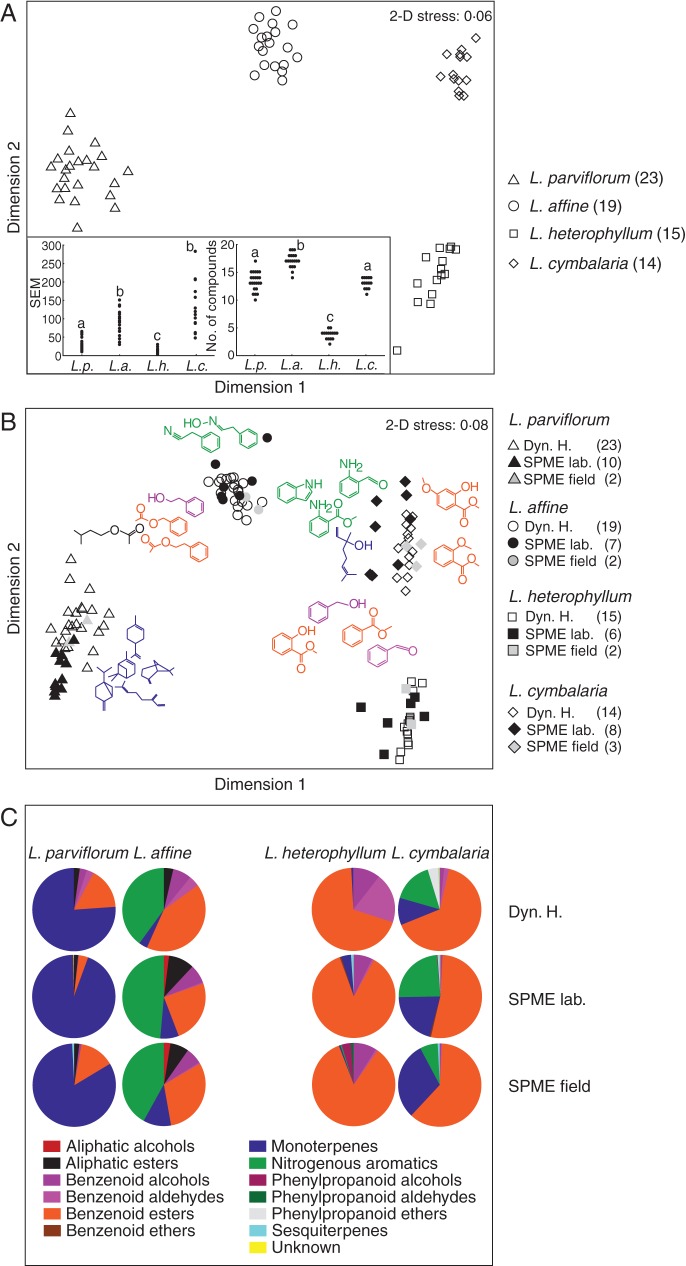
Fig. 1.
(A) Floral scent variation in the four species presented as a two-dimensional MDS plot showing within- and between-species relationships among samples generated through dynamic headspace analysis (square-root transformed data; sample sizes shown in brackets). Insert graphs show the standardized scent emission (SEM) in nanograms scent per flower per hour (estimated from the internal standard; left), and the total number of compounds emitted by the different species (right). Different letters denote significant differences between groups (P < 0·05). (B) Comparison between different techniques (SPME and dynamic headspace) and sample locations (laboratory/field) shown as a MDS plot of proportional data (arcsine-square-root transformed), including the compounds of most importance for scent variation (colour coded by compound group). (C) Pie diagrams showing the relative contribution (untransformed) of different compound groups to the floral scent bouquet of the four species.

