
Fig. 2.
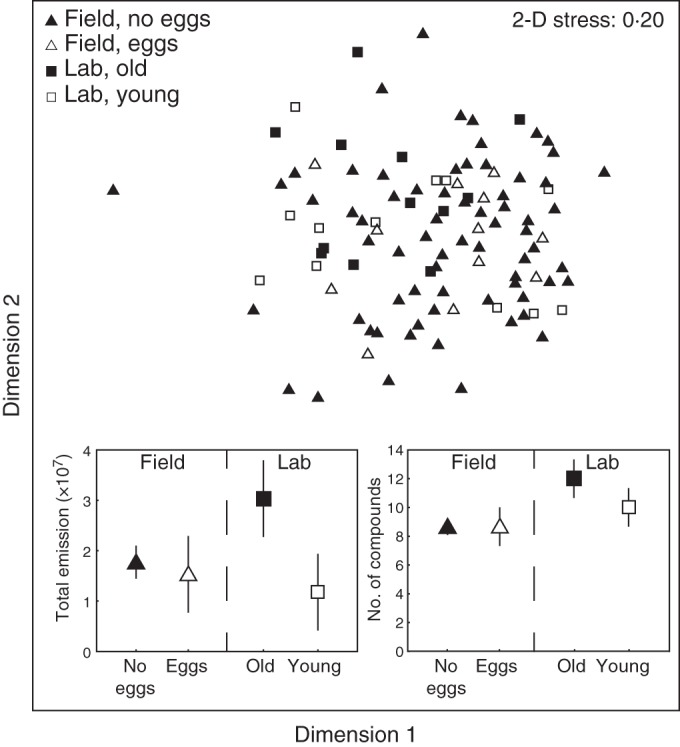
Floral scent variation in the single flower collections of L. cymbalaria including field-collected flowers with and without G. politella eggs, as well as young and old greenhouse-grown plants tested in the laboratory. The main figure shows the multivariate results as an MDS-plot. The insert on the left shows the total scent emission (the average summed peak size measured as total ion abundance in the GC/MS ± 95 % CI), and the insert on the right shows the average number of compounds present in the four groups (±95 % CI).