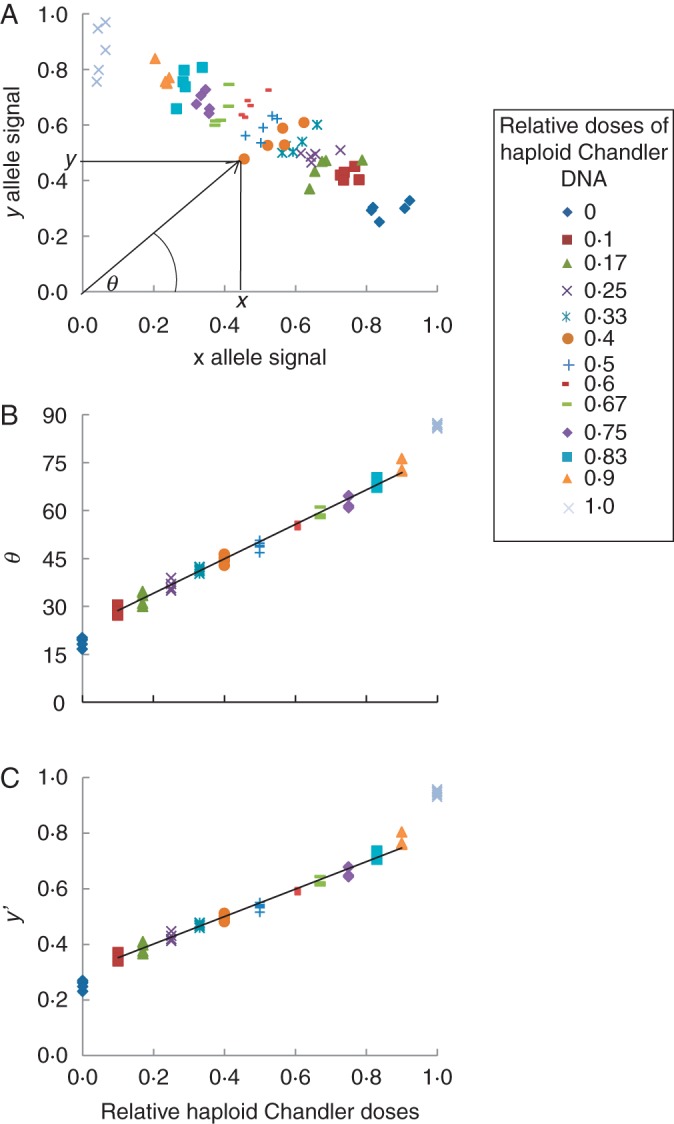
Fig. 1.

Correlation study of allele doses and x, y signals for the CiC2840-01 SNP marker. (A) Plot of normalized x, y allele signals. (B) Correlation between relative haploid Chandler doses and theta angle [θ = tan−1 (y/x)]. (C) Correlation between relative haploid Chandler doses and the y′ parameter [y′ = y(x + y)].
