Fig. 4.
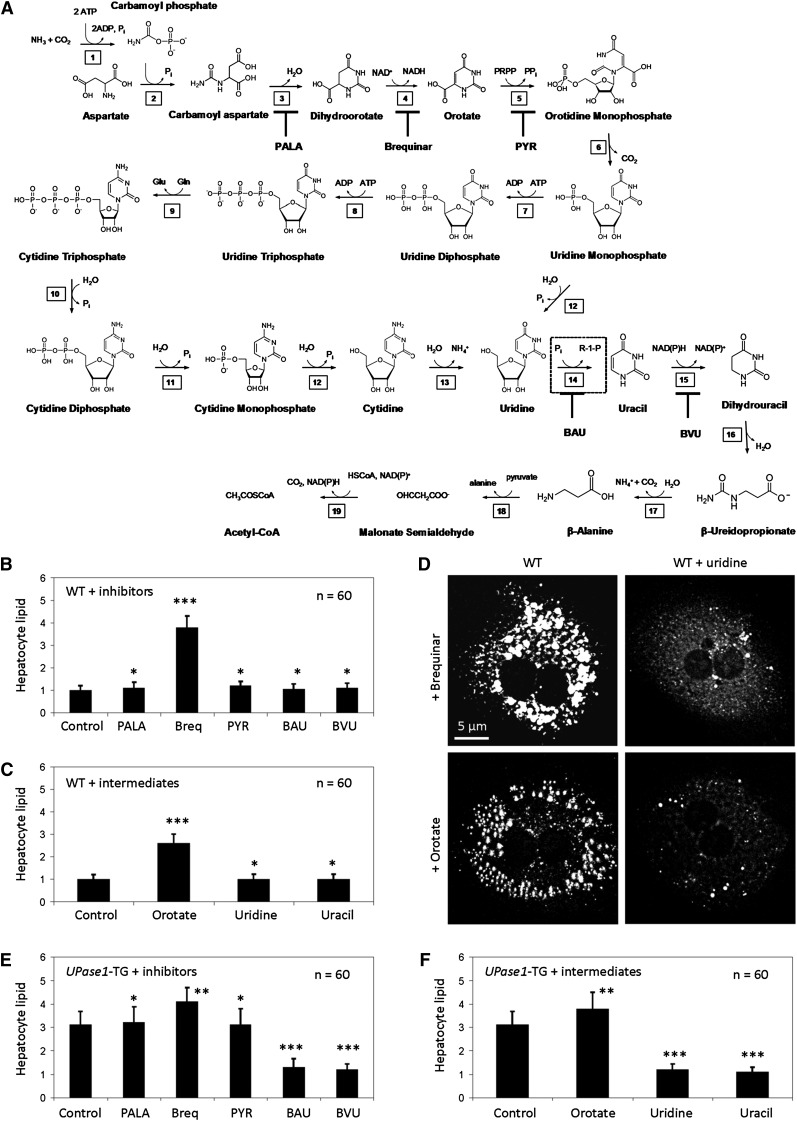
Inhibition of DHDOH induces steatosis, and inhibition of uridine catabolism suppresses steatosis. (A) Pyrimidine biosynthesis and catabolism pathway. 1) Carbamoyl phosphate synthetase; 2) Aspartic transcarbamoylase; 3) Dihydroorotase; 4) Dihydroorotate dehydrogenase (DHODH); 5) Orotate phosphoribosyltransferase; 6) Orotidine 5′-phosphate decarboxylase; 7) Uridine-cytidine kinase 2; 8) Nucleoside-diphosphate kinase; 9) Cytidine triphosphate synthase; 10) Nucleoside triphosphatase; 11) Nucleoside diphosphatase; 12) Nucleotidase; 13) Cytidine deaminase; 14) Uridine phosphorylase (UPase, dashed box); 15) Dihydropyrimidine dehydrogenase (DPD); 16) Hydropyrimidine hydratase (also known as dihydropyrimidinase); 17) β-Ureidopropionase; 18) 3-Alanine-pyruvate transaminase; 19) Malonate semialdehyde dehydrogenase. Inhibitors of the pyrimidine biosynthesis and catabolism pathway are N-(phosphonacetyl)-l-aspartate (PALA), brequinar, pyrazofurin (PYR), 5-benzylacyclouridine (BAU), and 5-(2-bromovinyl)uracil (BVU). (B) Brequinar, an allosteric inhibitor of DHODH, and (C) orotate, an enzymatic product of DHODH, induce lipid phenotype in wild-type hepatocytes. Error bars are standard deviations of 60 hepatocytes analyzed per experimental condition. (D) Uridine supplementation suppresses lipid phenotype induced by brequinar and orotate. (E) BAU and BVU suppress lipid phenotype of UPase1-TG hepatocytes. (F) Uridine and uracil supplementation suppress lipid phenotype of UPase1-TG hepatocytes. Error bars are standard deviations of 60 hepatocytes analyzed per animal group or treatment condition. *P < 0.05, **P < 0.01, ***P < 0.001 versus control. P values were calculated using Excel's paired Student t-test function.

