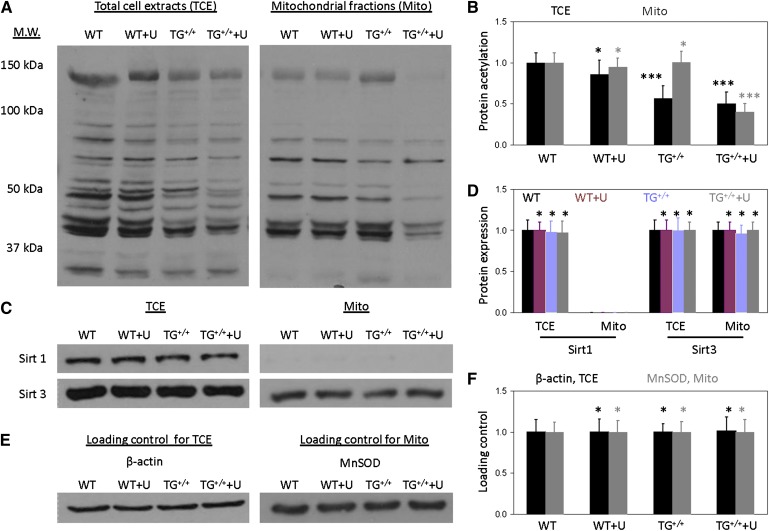
Fig. 7.
1-D Western blot reveals uridine-induced changes to the liver protein acetylation profile of UPase1-TG mice. Western blot lane assignment: WT, wild-type; WT+U, wild-type + uridine; TG+/+, UPase1-TG; TG+/++U, UPase1-TG + uridine. (A) Protein lysine acetylation profiles of total-cell extracts (TCE) and mitochondrial fractions (Mito). (B) Quantitative analysis of protein lysine acetylation profiles presented in (A). (C) Sirt1 and Sirt3 protein expression level of TCE and Mito. (D) Quantitative analysis of Sirt1 and Sirt3 protein expression level presented in (C). (E) Loading controls for TCE and Mito samples presented in both (A) and (C). β-actin and mitochondrial manganese superoxide dismutase (MnSOD) were used as loading controls for TCE and Mito, respectively. All data presented are representative of three mice per animal or treatment group used for Western blot analysis. (F) Quantitative analysis of loading controls presented in (E). Data are normalized to 1 for WT control and respectively, for UPase1-TG. Error bars are standard deviations across three mice per animal group evaluated. *P < 0.05, **P < 0.01, ***P < 0.001 versus WT control (black asterisks, TCE; gray asterisks, Mito). P values were calculated using Excel’s paired Student t-test function.

