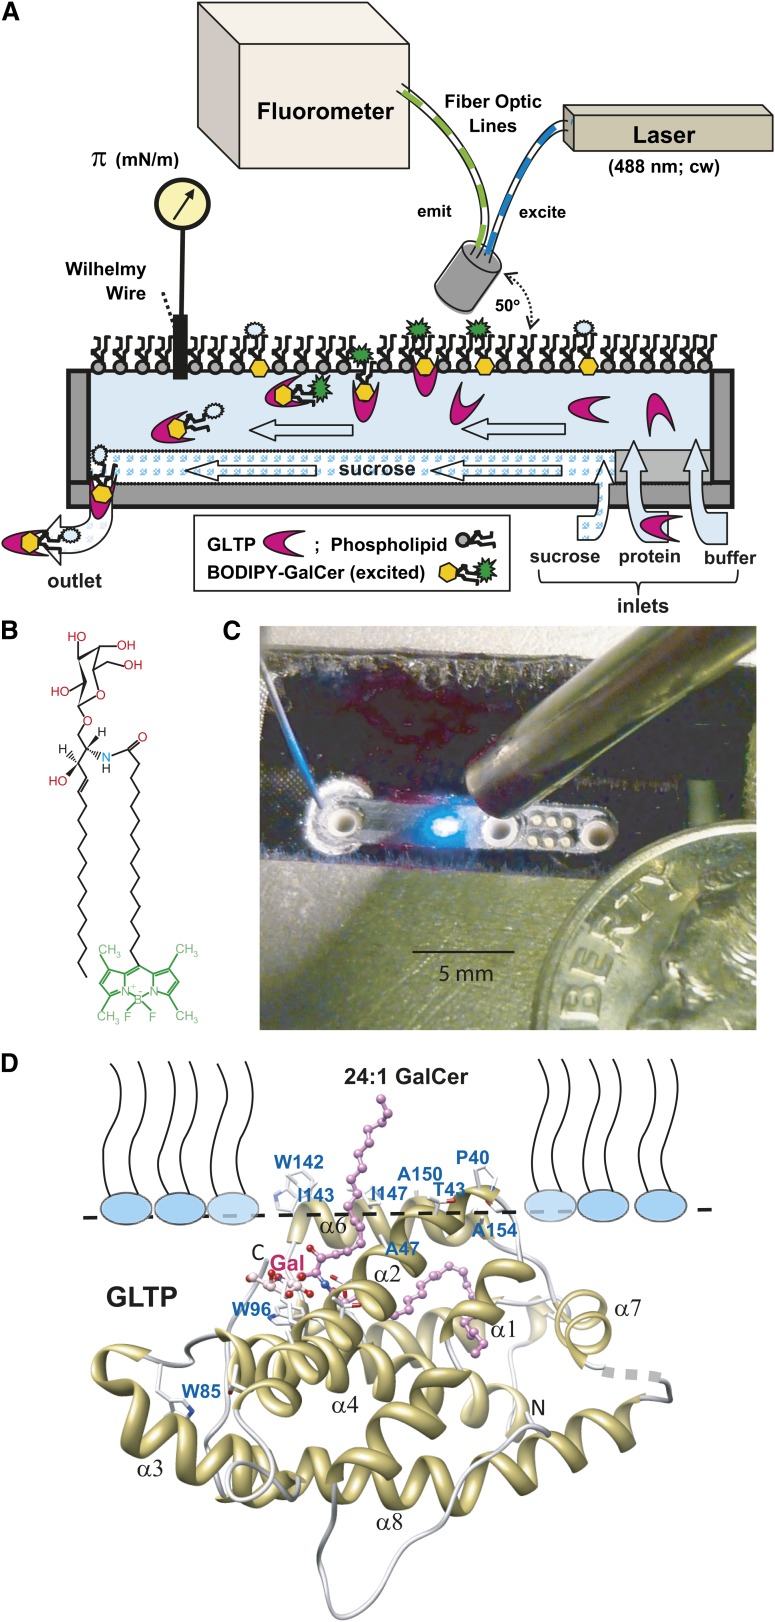
Fig. 1.
A: Microfluidic flow cell monolayer apparatus configured to monitor surface pressure while simultaneously measuring fluorescence intensity (not drawn to scale; see Materials and Methods for a detailed description). B: Chemical structure of B15-GalCer fluorophore. C: Photo of microfluidic flow trough. D: Docking of GLTP containing bound 24:1-GalCer with the monolayer interface as predicted by the Orientation of Proteins in Membranes computational approach and analyzed by Trp fluorescence (19).

