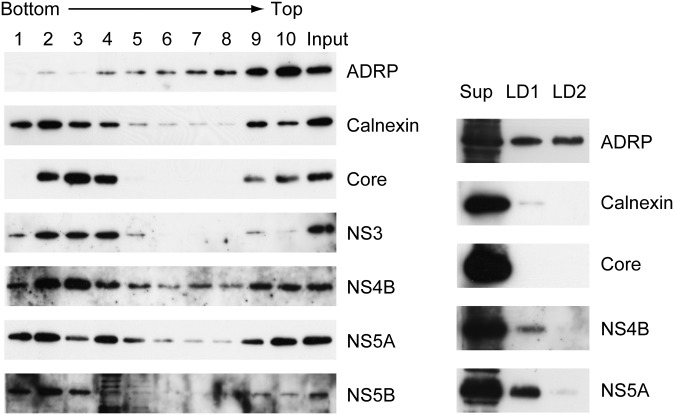
Fig. 2.
Localization of HCV antigens to LDs in OR6 cells. (Left) Distribution of cellular and HCV antigens in fractions obtained by discontinuous sucrose density gradient ultracentrifugation (51, 43, 35, 26, 18, 10, and 2% sucrose from bottom to top). OR6 cells were fractionated. The 1/100 vol of each fraction (1–10) and 1/1,000 vol of original PNS (Input) were run on 12% SDS-PAGE followed by immunoblot analysis. (Right) Localization of HCV antigens to LD preparations. LDs were prepared from OR6 cells. LD1, LD preparation obtained from first ultracentrifugation; LD2, final LD preparation obtained from second ultracentrifugation; Sup (S16), supernatant after 16,000 g centrifugation. Fractions were analyzed by immunoblotting. The amount of each fraction applied for immunoblotting was adjusted to give approximately equal signal intensity for ADRP. The apparent molecular weights of the indicated proteins were: ADRP, 52 kDa; calnexin, 90 kDa; Core, 21 kDa; NS3, 70 kDa; NS4B, 27 kDa; NS5A, 56/58 kDa; and NS5B, 66 kDa.

