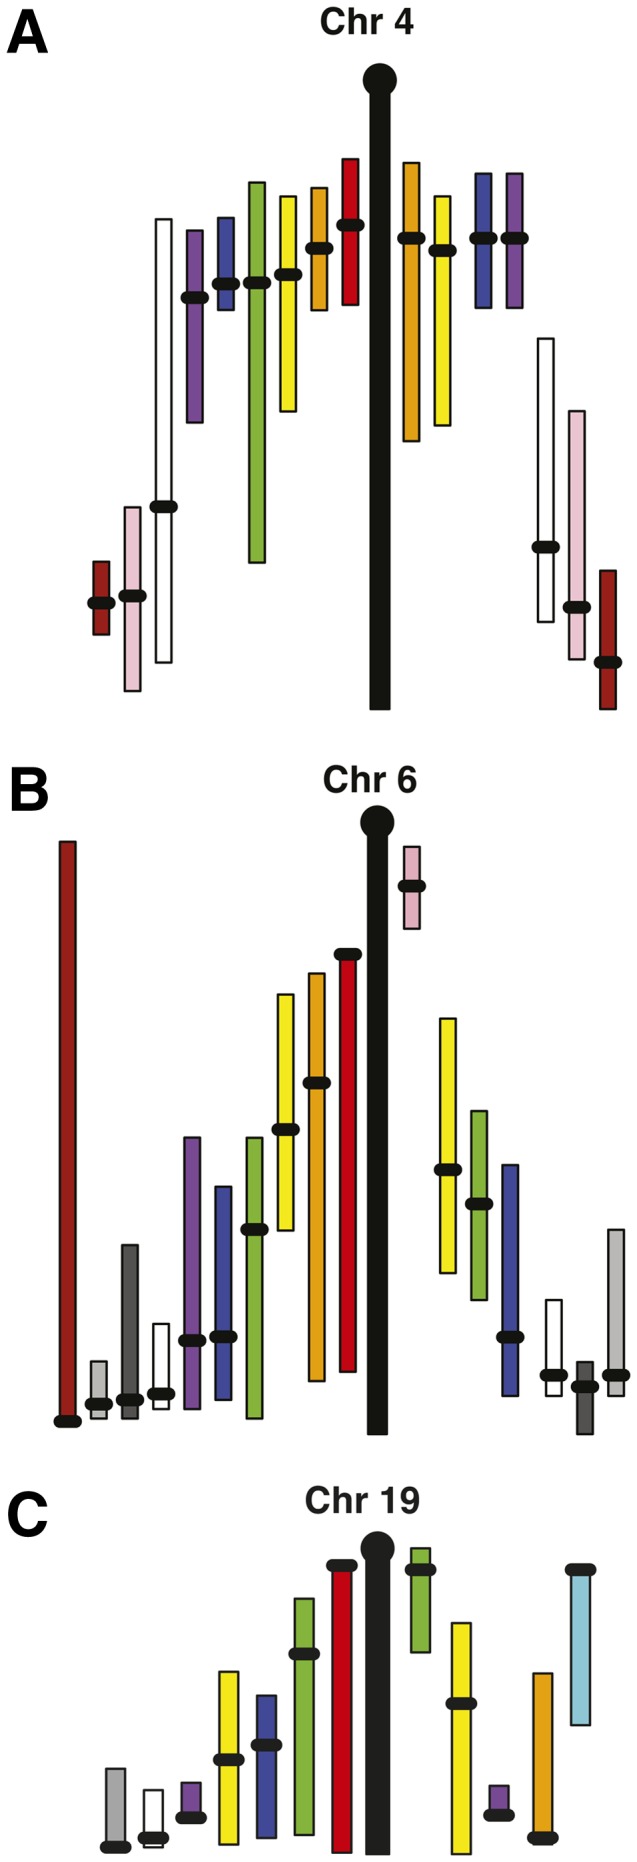
Fig. 3.

Chromosomes 4 (A), 6 (B), and 19 (C) with the old map positions on the right and the new QTL map positions on the left. Each bar represents the confidence interval of a QTL within a cross, with the black dot indicating the peak. Bars with the same color on the left and right are QTL in the same cross.
