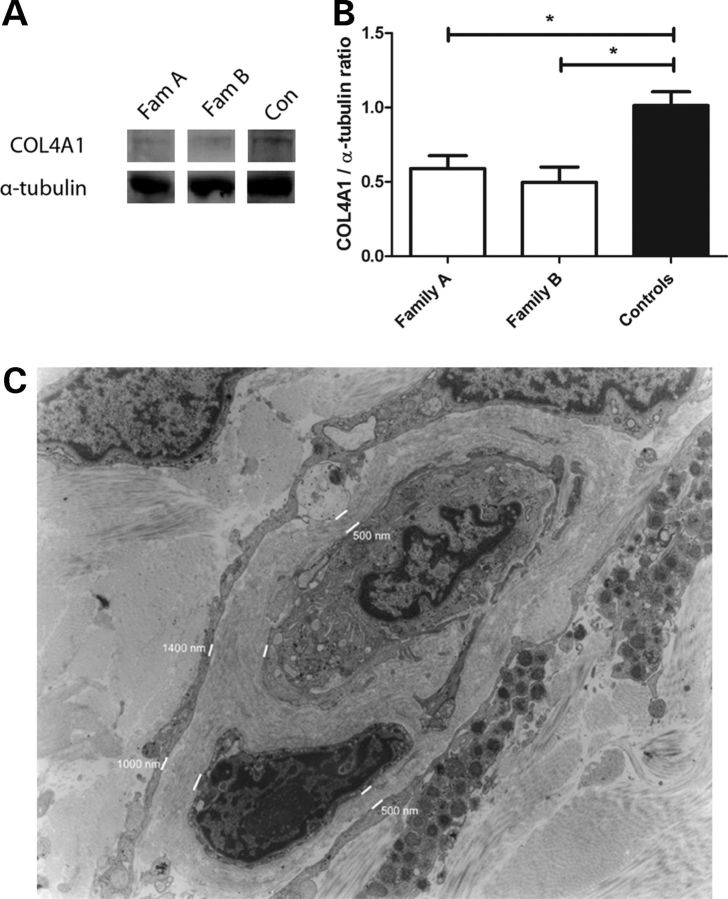
Figure 3.
COL4A1 expression was analyzed in fibroblasts of patients (patient II:1 and III:1 of family A; patient III:3 of family B) and four controls and normalized to α-tubulin. A marked reduction was observed in both the families (A) which was confirmed by quantification (B) (data are expressed as mean ± SEM, *P < 0.05). Electron micrograph of a skin capillary of patient II:1 (magnification ×1200) showed striking thickening of the basement membrane (C). The thickness of the basement membrane is indicated in nanometer.

